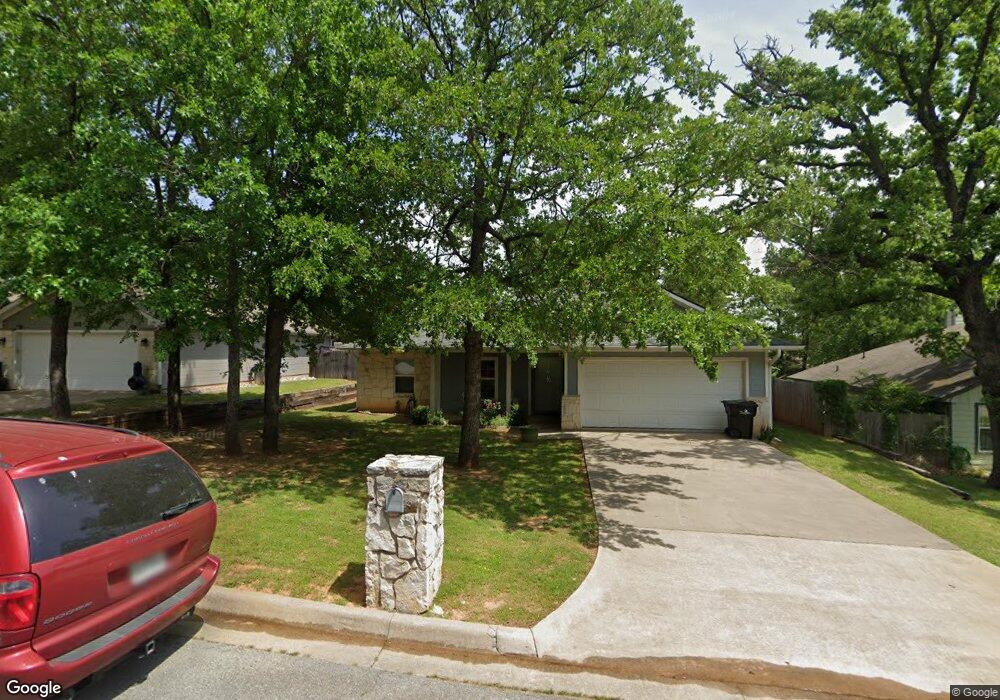
3118 Belle Ave Denison, TX 75020
Estimated Value: $257,631 - $286,000
3
Beds
2
Baths
1,464
Sq Ft
$186/Sq Ft
Est. Value
About This Home
This home is located at 3118 Belle Ave, Denison, TX 75020 and is currently estimated at $271,816, approximately $185 per square foot. 3118 Belle Ave is a home located in Grayson County with nearby schools including Hyde Park Elementary School, Scott Middle School, and Denison High School.
Ownership History
Date
Name
Owned For
Owner Type
Purchase Details
Closed on
Aug 4, 2022
Sold by
Marie Pothoff Gayle
Bought by
Pothoff James Bryan and Pothoff Richard Alan
Current Estimated Value
Purchase Details
Closed on
Jun 9, 2008
Sold by
Elliott Jason W and Elliott Wendy D
Bought by
Pothoff Gayle Marie
Purchase Details
Closed on
Feb 8, 2006
Sold by
Moore Terry D
Bought by
Elliott Jason W and Elliott Wendy D
Home Financials for this Owner
Home Financials are based on the most recent Mortgage that was taken out on this home.
Original Mortgage
$118,960
Interest Rate
6.18%
Mortgage Type
FHA
Purchase Details
Closed on
Mar 18, 2005
Sold by
Rumsey Investments Llc
Bought by
Moore Terry D
Home Financials for this Owner
Home Financials are based on the most recent Mortgage that was taken out on this home.
Original Mortgage
$87,996
Interest Rate
5.66%
Mortgage Type
Purchase Money Mortgage
Create a Home Valuation Report for This Property
The Home Valuation Report is an in-depth analysis detailing your home's value as well as a comparison with similar homes in the area
Home Values in the Area
Average Home Value in this Area
Purchase History
| Date | Buyer | Sale Price | Title Company |
|---|---|---|---|
| Pothoff James Bryan | -- | None Listed On Document | |
| Pothoff Gayle Marie | -- | Security Title Inc | |
| Elliott Jason W | -- | Chapin Title Co Inc | |
| Moore Terry D | -- | -- |
Source: Public Records
Mortgage History
| Date | Status | Borrower | Loan Amount |
|---|---|---|---|
| Previous Owner | Elliott Jason W | $118,960 | |
| Previous Owner | Moore Terry D | $87,996 |
Source: Public Records
Tax History Compared to Growth
Tax History
| Year | Tax Paid | Tax Assessment Tax Assessment Total Assessment is a certain percentage of the fair market value that is determined by local assessors to be the total taxable value of land and additions on the property. | Land | Improvement |
|---|---|---|---|---|
| 2025 | $703 | $280,291 | $83,243 | $197,048 |
| 2024 | $6,154 | $264,898 | $0 | $0 |
| 2023 | $703 | $240,816 | $0 | $0 |
| 2022 | $5,201 | $218,924 | $0 | $0 |
| 2021 | $5,020 | $204,510 | $40,448 | $164,062 |
| 2020 | $4,772 | $180,929 | $22,945 | $157,984 |
| 2019 | $5,205 | $189,634 | $22,945 | $166,689 |
| 2018 | $4,770 | $179,450 | $22,945 | $156,505 |
| 2017 | $4,373 | $156,329 | $21,985 | $134,344 |
| 2016 | $4,208 | $154,662 | $21,985 | $132,677 |
| 2015 | $1,868 | $136,733 | $19,850 | $116,883 |
| 2014 | $2,015 | $131,050 | $18,143 | $112,907 |
Source: Public Records
Map
Nearby Homes
- 1803 Woodland Park Dr
- 1838 Park Ave
- 2100 Deer Run
- 2131 Deer Run
- 3312 Vine Ln
- 1130 Amsden Cir
- 2111 Renaissance Dr
- 2108 Turtlecreek
- 527 W Coffin St
- 3101 S College Blvd
- 1901 Woodlawn Blvd
- 938 Amsden St
- 2206 Bluebonnet Ave
- 923 Dubois St
- 905 Seymore Cir
- 903 Seymore Cir
- 2406 Loy Lake Rd
- 919 W Collins St
- 923 W Collins St
- 921 W Collins St
- 3200 Belle Ave
- 3114 Belle Ave
- 0 Belle Ave
- 3204 Belle Ave
- 1822 Woodland Park Dr
- 1820 Woodland Park Dr
- 1802 Woodland Park Dr
- 1800 Woodland Park Dr
- 1800 Woodland Ave
- 1804 Woodland Park Dr
- 1818 Woodland Park Dr
- 1824 Woodland Park Dr
- 3117 Belle Ave
- 3201 Belle Ave
- 3208 Belle Ave
- 1806 Woodland Park Dr
- 3113 Belle Ave
- 3205 Belle Ave
- Lot 39 Woodland Park Dr
- 1826 Woodland Park Dr