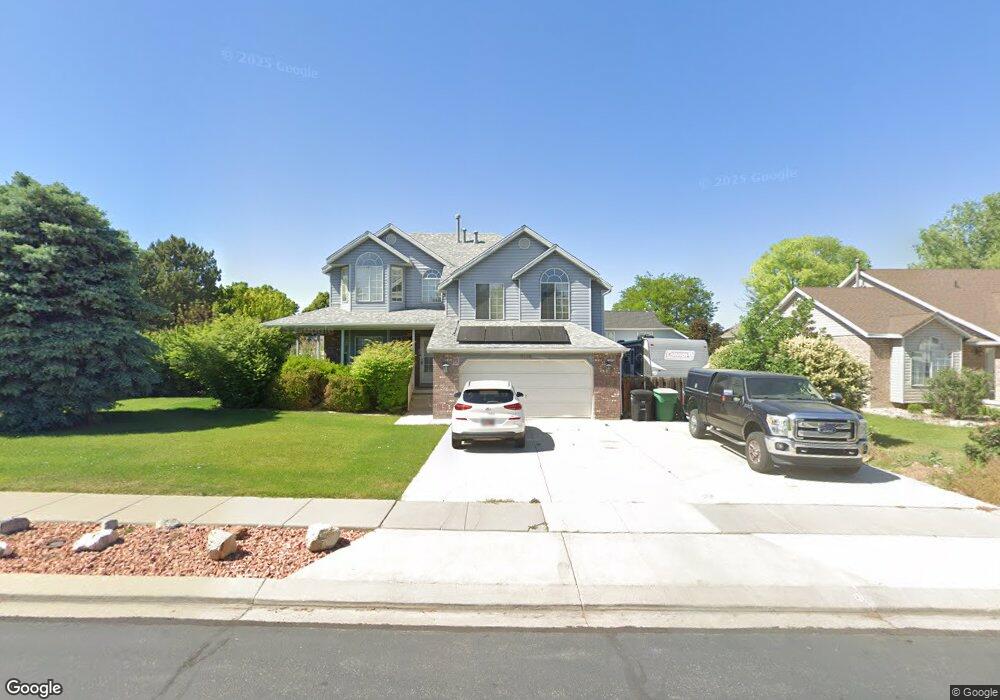
3118 W 7670 S West Jordan, UT 84084
Estimated Value: $579,552 - $689,000
4
Beds
3
Baths
2,456
Sq Ft
$253/Sq Ft
Est. Value
About This Home
This home is located at 3118 W 7670 S, West Jordan, UT 84084 and is currently estimated at $621,638, approximately $253 per square foot. 3118 W 7670 S is a home located in Salt Lake County with nearby schools including Oquirrh Elementary School, Joel P. Jensen Middle School, and West Jordan High School.
Ownership History
Date
Name
Owned For
Owner Type
Purchase Details
Closed on
Oct 6, 2020
Sold by
Nosack Michael J and Nosack Cristine S
Bought by
Nosack Michael J and Nosack Cristine S
Current Estimated Value
Home Financials for this Owner
Home Financials are based on the most recent Mortgage that was taken out on this home.
Original Mortgage
$256,700
Outstanding Balance
$228,321
Interest Rate
2.9%
Mortgage Type
New Conventional
Estimated Equity
$393,317
Purchase Details
Closed on
Jul 14, 1998
Sold by
Nosack Michael J and Nosack Christine S
Bought by
Nosack Michael J and Nosack Cristine S
Purchase Details
Closed on
Mar 24, 1994
Sold by
D R Horton Inc
Bought by
Nosack Michael J and Nosack Christine S
Home Financials for this Owner
Home Financials are based on the most recent Mortgage that was taken out on this home.
Original Mortgage
$135,250
Interest Rate
7.21%
Create a Home Valuation Report for This Property
The Home Valuation Report is an in-depth analysis detailing your home's value as well as a comparison with similar homes in the area
Home Values in the Area
Average Home Value in this Area
Purchase History
| Date | Buyer | Sale Price | Title Company |
|---|---|---|---|
| Nosack Michael J | -- | North American Title Llc | |
| Nosack Michael J | -- | -- | |
| Nosack Michael J | -- | -- |
Source: Public Records
Mortgage History
| Date | Status | Borrower | Loan Amount |
|---|---|---|---|
| Open | Nosack Michael J | $256,700 | |
| Previous Owner | Nosack Michael J | $135,250 |
Source: Public Records
Tax History Compared to Growth
Tax History
| Year | Tax Paid | Tax Assessment Tax Assessment Total Assessment is a certain percentage of the fair market value that is determined by local assessors to be the total taxable value of land and additions on the property. | Land | Improvement |
|---|---|---|---|---|
| 2025 | $2,863 | $568,000 | $134,100 | $433,900 |
| 2024 | $2,863 | $550,900 | $129,700 | $421,200 |
| 2023 | $2,757 | $499,900 | $122,400 | $377,500 |
| 2022 | $2,858 | $509,900 | $120,000 | $389,900 |
| 2021 | $2,385 | $389,900 | $90,000 | $299,900 |
| 2020 | $2,280 | $347,500 | $90,000 | $257,500 |
| 2019 | $2,296 | $343,100 | $90,000 | $253,100 |
| 2018 | $2,016 | $298,800 | $86,800 | $212,000 |
| 2017 | $1,897 | $280,000 | $86,800 | $193,200 |
| 2016 | $1,872 | $259,600 | $86,800 | $172,800 |
| 2015 | $1,544 | $208,700 | $88,500 | $120,200 |
| 2014 | $1,461 | $194,400 | $84,400 | $110,000 |
Source: Public Records
Map
Nearby Homes
- 3165 W 7720 S
- 7604 S Autumn Dr
- 2886 W 7550 S
- 7721 Sunset Cir
- 3066 W Linton Dr
- 7611 S Springbrook Dr
- 3354 W 7800 S
- 7987 S 2980 W
- 3422 Briar Dr
- 7642 S 2700 W
- 7942 S 2800 W
- 3476 W Spaulding Rd
- 7993 S 2760 W
- 3332 Lower Newark Way
- 7968 S 2700 W
- 8058 S Lismore Ln Unit 304
- 7361 S 2700 W
- 2573 Jordan Meadows Ln
- 7647 S 2500 W
- 3546 W 7980 S
- 3132 W 7670 S
- 3104 W 7670 S
- 3107 Elk Ridge Cir
- 3117 Elk Ridge Cir
- 3123 W 7670 S
- 3109 W 7670 S
- 3148 W 7670 S
- 7646 Elk Ridge Dr
- 7634 Elk Ridge Dr
- 3137 W 7670 S
- 3095 W 7670 S
- 3158 W 7670 S
- 3151 W 7670 S
- 3118 W 7720 S
- 3116 Elk Ridge Cir
- 3106 W 7720 S
- 3083 W 7670 S
- 3134 W 7720 S
- 3106 Elk Ridge Cir
- 3094 W 7720 S