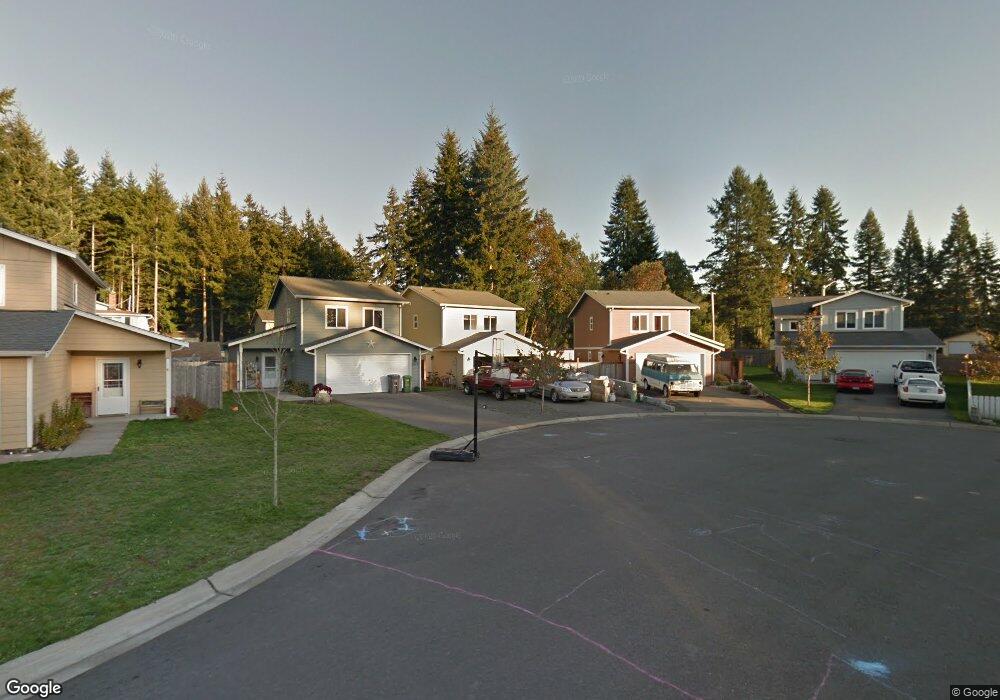
3119 Chive Place SE Port Orchard, WA 98366
East Port Orchard NeighborhoodEstimated Value: $420,845 - $434,000
3
Beds
2
Baths
1,200
Sq Ft
$354/Sq Ft
Est. Value
About This Home
This home is located at 3119 Chive Place SE, Port Orchard, WA 98366 and is currently estimated at $425,211, approximately $354 per square foot. 3119 Chive Place SE is a home with nearby schools including East Port Orchard Elementary School, Marcus Whitman Middle School, and South Kitsap High School.
Ownership History
Date
Name
Owned For
Owner Type
Purchase Details
Closed on
May 2, 2019
Sold by
Bretey Nicholas
Bought by
Lester Jessica N and Lester Brandon T
Current Estimated Value
Home Financials for this Owner
Home Financials are based on the most recent Mortgage that was taken out on this home.
Original Mortgage
$256,358
Outstanding Balance
$225,391
Interest Rate
4.2%
Mortgage Type
New Conventional
Estimated Equity
$199,820
Purchase Details
Closed on
Jun 23, 2008
Sold by
Schell Andrew W and Schell Kyja A
Bought by
Kitsap County Consolidated Housing Autho
Home Financials for this Owner
Home Financials are based on the most recent Mortgage that was taken out on this home.
Original Mortgage
$9,600
Interest Rate
6.04%
Mortgage Type
Stand Alone Second
Purchase Details
Closed on
Jun 20, 2008
Sold by
Kitsap County Consolidated Housing Autho
Bought by
Bretey Nicholas
Home Financials for this Owner
Home Financials are based on the most recent Mortgage that was taken out on this home.
Original Mortgage
$9,600
Interest Rate
6.04%
Mortgage Type
Stand Alone Second
Create a Home Valuation Report for This Property
The Home Valuation Report is an in-depth analysis detailing your home's value as well as a comparison with similar homes in the area
Home Values in the Area
Average Home Value in this Area
Purchase History
| Date | Buyer | Sale Price | Title Company |
|---|---|---|---|
| Lester Jessica N | $269,850 | Fidelity Ntl Title | |
| Kitsap County Consolidated Housing Autho | $1,440,280 | Pacific Nw Title | |
| Bretey Nicholas | -- | Pacific Nw Title |
Source: Public Records
Mortgage History
| Date | Status | Borrower | Loan Amount |
|---|---|---|---|
| Open | Lester Jessica N | $256,358 | |
| Previous Owner | Kitsap County Consolidated Housing Autho | $9,600 | |
| Previous Owner | Bretey Nicholas | $184,350 |
Source: Public Records
Tax History Compared to Growth
Tax History
| Year | Tax Paid | Tax Assessment Tax Assessment Total Assessment is a certain percentage of the fair market value that is determined by local assessors to be the total taxable value of land and additions on the property. | Land | Improvement |
|---|---|---|---|---|
| 2026 | $2,890 | $327,030 | $59,470 | $267,560 |
| 2025 | $2,890 | $324,300 | $56,740 | $267,560 |
| 2024 | $2,803 | $324,300 | $56,740 | $267,560 |
| 2023 | $2,784 | $324,300 | $56,740 | $267,560 |
| 2022 | $2,735 | $267,040 | $52,990 | $214,050 |
| 2021 | $2,362 | $217,240 | $49,240 | $168,000 |
| 2020 | $2,318 | $207,250 | $46,890 | $160,360 |
| 2019 | $1,880 | $183,270 | $46,040 | $137,230 |
| 2018 | $1,976 | $150,480 | $46,040 | $104,440 |
| 2017 | $1,700 | $150,480 | $46,040 | $104,440 |
| 2016 | $1,675 | $135,800 | $46,040 | $89,760 |
| 2015 | $1,621 | $133,210 | $46,040 | $87,170 |
| 2014 | -- | $131,490 | $46,040 | $85,450 |
| 2013 | -- | $141,680 | $48,460 | $93,220 |
Source: Public Records
Map
Nearby Homes
- 3132 Harris Rd SE
- 2198 SE Galeel Ct
- 2360 SE Plymouth Way
- 2315 SE Kelby Cir
- 2225 SE Kelby Cir
- 2313 Lincoln Ave SE
- 0 Lincoln Ave SE
- 1330 SE Casandra Loop
- 3131 SE Berger Ln
- 2235 Eisenhower Ave SE
- 2673 Harold Dr SE
- 2948 SE Alson Ct
- 3922 Bethel Rd SE
- 1350 SE Shelton Ln
- 1743 SE Crawford Rd
- 3463 Balsam Blvd SE
- 2808 Pine Cone Ct SE
- 2124 Pine Tree Dr SE
- 2475 Parkwood Dr SE
- 2116 Pine Tree Dr SE
- 3113 Chive Place SE
- 3125 Chive Place SE
- 2236 SE Basil Ct
- 3131 Chive Place SE
- 3101 Chive Place SE
- 2355 SE Lund Ave
- 3130 Chive Place SE
- 2359 SE Lund Ave
- 2345 SE Lund Ave
- 3124 Chive Place SE
- 3118 Chive Place SE
- 3100 Chive Place SE
- 3106 Chive Place SE
- 2231 SE Basil Ct
- 2237 SE Basil Ct
- 2225 SE Basil Ct
- 2219 SE Basil Ct
- 2239 SE Lund Ave
- 2310 SE Lund Ave