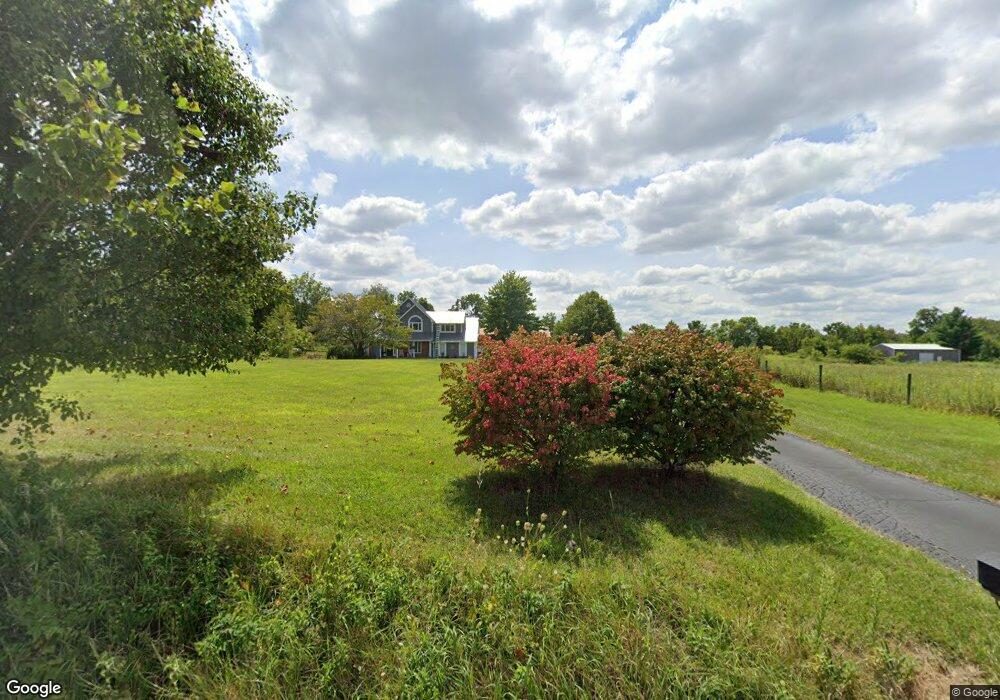
3119 E 400 N Greenfield, IN 46140
Estimated Value: $474,000 - $584,583
4
Beds
3
Baths
2,738
Sq Ft
$192/Sq Ft
Est. Value
About This Home
This home is located at 3119 E 400 N, Greenfield, IN 46140 and is currently estimated at $524,896, approximately $191 per square foot. 3119 E 400 N is a home located in Hancock County with nearby schools including Maxwell Intermediate School, Eden Elementary School, and Greenfield Central Junior High School.
Ownership History
Date
Name
Owned For
Owner Type
Purchase Details
Closed on
Feb 24, 2011
Sold by
Fannie Mae
Bought by
Griner Matthew C and Griner Stacy
Current Estimated Value
Home Financials for this Owner
Home Financials are based on the most recent Mortgage that was taken out on this home.
Original Mortgage
$190,000
Outstanding Balance
$130,917
Interest Rate
4.85%
Mortgage Type
New Conventional
Estimated Equity
$393,979
Purchase Details
Closed on
Jan 11, 2011
Sold by
Bac Home Loans Servicing Lp
Bought by
Federal National Mortgage Association
Home Financials for this Owner
Home Financials are based on the most recent Mortgage that was taken out on this home.
Original Mortgage
$190,000
Outstanding Balance
$130,917
Interest Rate
4.85%
Mortgage Type
New Conventional
Estimated Equity
$393,979
Purchase Details
Closed on
Sep 9, 2010
Sold by
Woods Gary L
Bought by
Countrywide Home Loans Servicing Lp
Purchase Details
Closed on
Nov 13, 2009
Sold by
Cregar Kimberly S
Bought by
Wood Gary L
Create a Home Valuation Report for This Property
The Home Valuation Report is an in-depth analysis detailing your home's value as well as a comparison with similar homes in the area
Home Values in the Area
Average Home Value in this Area
Purchase History
| Date | Buyer | Sale Price | Title Company |
|---|---|---|---|
| Griner Matthew C | -- | -- | |
| Federal National Mortgage Association | -- | -- | |
| Countrywide Home Loans Servicing Lp | $256,577 | -- | |
| Wood Gary L | -- | -- |
Source: Public Records
Mortgage History
| Date | Status | Borrower | Loan Amount |
|---|---|---|---|
| Open | Griner Matthew C | $190,000 |
Source: Public Records
Tax History Compared to Growth
Tax History
| Year | Tax Paid | Tax Assessment Tax Assessment Total Assessment is a certain percentage of the fair market value that is determined by local assessors to be the total taxable value of land and additions on the property. | Land | Improvement |
|---|---|---|---|---|
| 2024 | $3,465 | $417,900 | $89,600 | $328,300 |
| 2023 | $3,465 | $386,600 | $89,600 | $297,000 |
| 2022 | $2,925 | $340,700 | $45,400 | $295,300 |
| 2021 | $2,289 | $276,800 | $45,400 | $231,400 |
| 2020 | $2,273 | $267,100 | $45,400 | $221,700 |
| 2019 | $2,193 | $258,200 | $45,400 | $212,800 |
| 2018 | $2,223 | $256,600 | $45,400 | $211,200 |
| 2017 | $2,408 | $259,000 | $45,400 | $213,600 |
| 2016 | $2,468 | $248,000 | $45,100 | $202,900 |
| 2014 | $2,432 | $246,400 | $44,100 | $202,300 |
| 2013 | $2,432 | $250,100 | $44,100 | $206,000 |
Source: Public Records
Map
Nearby Homes
- 3494 N 300 E
- 2330 E Mill Stream Dr
- 3696 N State Road 9
- 3598 N State Road 9
- 4778 N Country Mill Dr
- 5176 N 300 E
- 4786 N Mill Ct
- 2708 N 400 E
- 3669 N Kelly Dr
- 108 S Center St
- 7 Holmes Ct
- 2334 Dillon Dr
- 1739 Moss Landing Ln
- 1751 Moss Landing Ln
- 1763 Moss Landing Ln
- 2326 Fir Dr
- 2308 Dillon Dr
- 2311 Dillon Dr
- 1648 Hemlock Cir
- 1624 Hemlock Cir