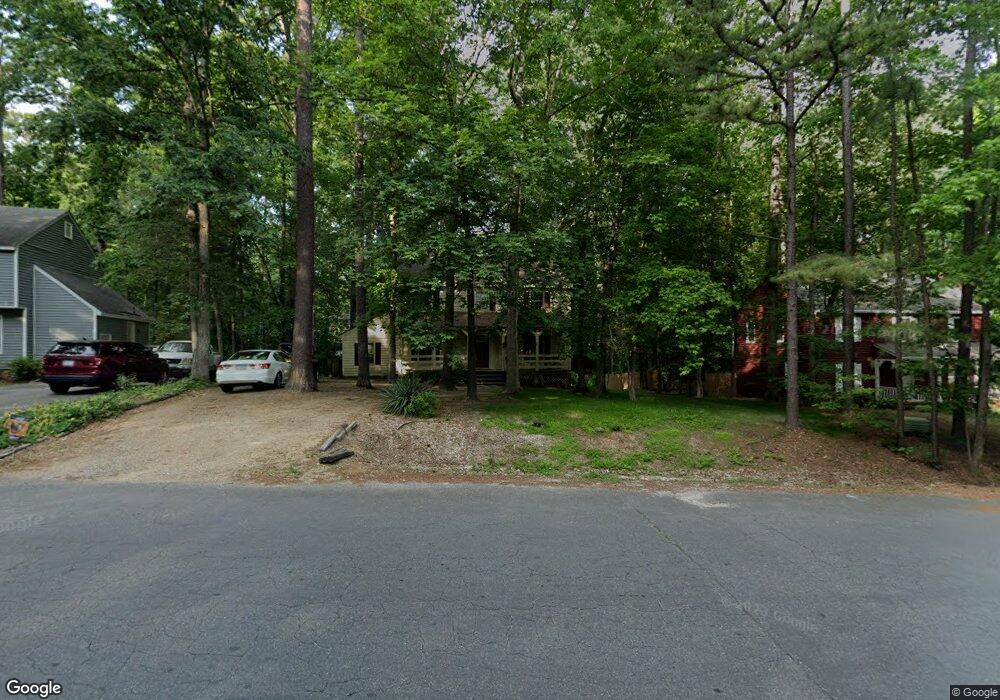
3119 Fox Chase Dr Midlothian, VA 23112
Estimated Value: $373,885 - $389,000
4
Beds
3
Baths
1,848
Sq Ft
$206/Sq Ft
Est. Value
About This Home
This home is located at 3119 Fox Chase Dr, Midlothian, VA 23112 and is currently estimated at $381,221, approximately $206 per square foot. 3119 Fox Chase Dr is a home located in Chesterfield County with nearby schools including Swift Creek Elementary School, Swift Creek Middle, and Clover Hill High.
Ownership History
Date
Name
Owned For
Owner Type
Purchase Details
Closed on
Oct 13, 2021
Sold by
Pine Cone Investments Xi Llc
Bought by
Pine Cone Investments Iv Llc
Current Estimated Value
Home Financials for this Owner
Home Financials are based on the most recent Mortgage that was taken out on this home.
Original Mortgage
$1,426,875
Outstanding Balance
$1,301,177
Interest Rate
2.8%
Mortgage Type
Stand Alone Refi Refinance Of Original Loan
Estimated Equity
-$919,956
Purchase Details
Closed on
Apr 30, 2001
Sold by
Sec Of Hud
Bought by
Cone Donald and Cone Siobhan S
Home Financials for this Owner
Home Financials are based on the most recent Mortgage that was taken out on this home.
Original Mortgage
$91,150
Interest Rate
6.88%
Mortgage Type
New Conventional
Purchase Details
Closed on
Feb 18, 1998
Sold by
Warsing Jerry W
Bought by
Lyons Mark R and Lyons Andrea D
Home Financials for this Owner
Home Financials are based on the most recent Mortgage that was taken out on this home.
Original Mortgage
$98,926
Interest Rate
6.9%
Mortgage Type
FHA
Create a Home Valuation Report for This Property
The Home Valuation Report is an in-depth analysis detailing your home's value as well as a comparison with similar homes in the area
Home Values in the Area
Average Home Value in this Area
Purchase History
| Date | Buyer | Sale Price | Title Company |
|---|---|---|---|
| Pine Cone Investments Iv Llc | -- | None Available | |
| Cone Donald | $91,102 | -- | |
| Lyons Mark R | $99,000 | -- |
Source: Public Records
Mortgage History
| Date | Status | Borrower | Loan Amount |
|---|---|---|---|
| Open | Pine Cone Investments Iv Llc | $1,426,875 | |
| Previous Owner | Lyons Mark R | $91,150 | |
| Previous Owner | Lyons Mark R | $98,926 |
Source: Public Records
Tax History Compared to Growth
Tax History
| Year | Tax Paid | Tax Assessment Tax Assessment Total Assessment is a certain percentage of the fair market value that is determined by local assessors to be the total taxable value of land and additions on the property. | Land | Improvement |
|---|---|---|---|---|
| 2025 | $2,899 | $322,900 | $78,000 | $244,900 |
| 2024 | $2,899 | $313,200 | $78,000 | $235,200 |
| 2023 | $2,641 | $290,200 | $72,000 | $218,200 |
| 2022 | $2,429 | $264,000 | $63,000 | $201,000 |
| 2021 | $2,264 | $235,700 | $61,000 | $174,700 |
| 2020 | $2,173 | $228,700 | $60,000 | $168,700 |
| 2019 | $2,080 | $218,900 | $58,000 | $160,900 |
| 2018 | $1,981 | $208,500 | $55,000 | $153,500 |
| 2017 | $1,860 | $193,800 | $52,000 | $141,800 |
| 2016 | $1,840 | $191,700 | $52,000 | $139,700 |
| 2015 | $1,774 | $182,200 | $46,500 | $135,700 |
| 2014 | $1,741 | $178,700 | $46,500 | $132,200 |
Source: Public Records
Map
Nearby Homes
- 3114 Fox Chase Dr
- 3200 Hunts Bridge Ct
- 3208 Quail Hill Dr
- 3207 Quail Hill Dr
- 3006 Three Bridges Rd
- 3301 Old Hundred Rd S
- 3401 Quail Hill Dr
- 13712 Woodbridge Crossing Way
- 3601 Quail Meadows Place
- 2980 Woodbridge Crossing Dr
- 2800 Fox Chase Ln
- 13931 Sagegrove Cir
- 3319 Seven Oaks Terrace
- 4018 Timber Ridge Rd
- 12918 Mill Meadow Ct
- 2411 Arrowood Rd
- 12760 Forest Mill Dr
- 12576 Petrel Crossing
- 12548 Petrel Crossing
- 13830 Crosstimbers Rd
- 3117 Fox Chase Dr
- 3201 Fox Chase Dr
- 13603 Hunts Bridge Rd
- 3203 Fox Chase Dr
- 3102 Quail Hill Dr
- 3115 Fox Chase Dr
- 13618 Hunts Bridge Rd
- 3116 Fox Chase Dr
- 13616 Hunts Bridge Rd
- 13620 Hunts Bridge Rd
- 3104 Quail Hill Dr
- 13614 Hunts Bridge Rd
- 3207 Fox Chase Dr
- 3112 Fox Chase Dr
- 3101 Quail Hill Dr
- 13621 Hunts Bridge Rd
- 3206 Fox Chase Dr
- 3103 Quail Hill Dr
- 3106 Quail Hill Dr
- 13610 Fox Chase Terrace