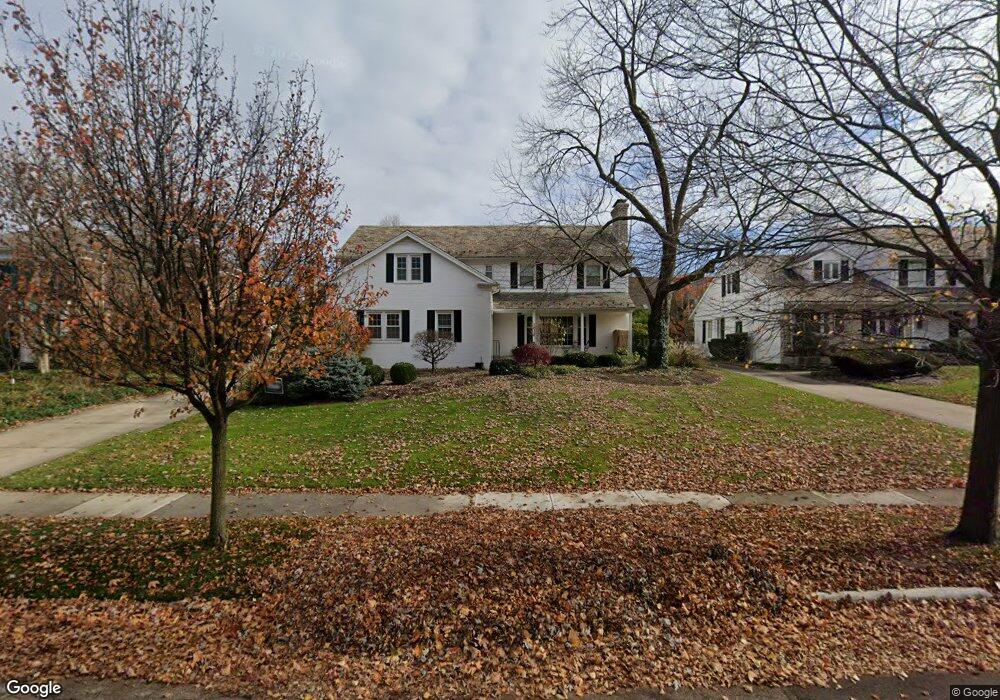
3119 Morley Rd Shaker Heights, OH 44122
Estimated Value: $510,000 - $634,000
5
Beds
3
Baths
2,868
Sq Ft
$203/Sq Ft
Est. Value
About This Home
This home is located at 3119 Morley Rd, Shaker Heights, OH 44122 and is currently estimated at $583,356, approximately $203 per square foot. 3119 Morley Rd is a home located in Cuyahoga County with nearby schools including Onaway Elementary School, Woodbury Elementary School, and Shaker Heights Middle School.
Ownership History
Date
Name
Owned For
Owner Type
Purchase Details
Closed on
Apr 25, 2000
Sold by
Janess Scott A
Bought by
Edelman Richard H and Edelman Kathryn Passov
Current Estimated Value
Home Financials for this Owner
Home Financials are based on the most recent Mortgage that was taken out on this home.
Original Mortgage
$252,700
Outstanding Balance
$87,929
Interest Rate
8.24%
Estimated Equity
$495,427
Purchase Details
Closed on
Mar 24, 1998
Sold by
Atwan Ismail and Atwan Elizabeth
Bought by
Janess Scott A
Home Financials for this Owner
Home Financials are based on the most recent Mortgage that was taken out on this home.
Original Mortgage
$194,000
Interest Rate
7%
Purchase Details
Closed on
Jun 25, 1987
Sold by
Hexter Barbara W
Bought by
Atwan Ismail
Purchase Details
Closed on
Jan 1, 1975
Bought by
Hexter Barbara W
Create a Home Valuation Report for This Property
The Home Valuation Report is an in-depth analysis detailing your home's value as well as a comparison with similar homes in the area
Home Values in the Area
Average Home Value in this Area
Purchase History
| Date | Buyer | Sale Price | Title Company |
|---|---|---|---|
| Edelman Richard H | $300,000 | Surety Title Agency Inc | |
| Janess Scott A | $242,500 | Guardian Title | |
| Atwan Ismail | $200,000 | -- | |
| Hexter Barbara W | -- | -- |
Source: Public Records
Mortgage History
| Date | Status | Borrower | Loan Amount |
|---|---|---|---|
| Open | Edelman Richard H | $252,700 | |
| Previous Owner | Janess Scott A | $194,000 |
Source: Public Records
Tax History Compared to Growth
Tax History
| Year | Tax Paid | Tax Assessment Tax Assessment Total Assessment is a certain percentage of the fair market value that is determined by local assessors to be the total taxable value of land and additions on the property. | Land | Improvement |
|---|---|---|---|---|
| 2024 | $15,536 | $174,335 | $29,820 | $144,515 |
| 2023 | $15,419 | $137,100 | $28,320 | $108,780 |
| 2022 | $14,968 | $137,100 | $28,320 | $108,780 |
| 2021 | $14,916 | $137,100 | $28,320 | $108,780 |
| 2020 | $15,545 | $134,400 | $27,760 | $106,650 |
| 2019 | $15,321 | $384,000 | $79,300 | $304,700 |
| 2018 | $15,409 | $134,400 | $27,760 | $106,650 |
| 2017 | $14,588 | $120,970 | $22,790 | $98,180 |
| 2016 | $14,003 | $120,970 | $22,790 | $98,180 |
| 2015 | $13,701 | $120,970 | $22,790 | $98,180 |
| 2014 | $13,701 | $114,100 | $21,490 | $92,610 |
Source: Public Records
Map
Nearby Homes
- 3133 Somerset Dr
- 3180 Somerset Dr
- 3279 Warrensville Center Rd Unit 3 A
- 3279 Warrensville Center Rd Unit 15D
- 19200 S Woodland Rd
- 21262 S Woodland Rd
- 20975 Farnsleigh Rd
- 19901 Van Aken Blvd Unit C-106
- 19901 Van Aken Blvd Unit 205C
- 19901 Van Aken Blvd Unit 7
- 3148 Belvoir Blvd
- 19201 Van Aken Blvd Unit 211
- 19201 Van Aken Blvd Unit 114
- 19201 Van Aken Blvd Unit 510
- 19201 Van Aken Blvd Unit 513
- 19101 Van Aken Blvd Unit 219
- 20945 Halworth Rd
- 19627 Winslow Rd
- 20930 Halworth Rd
- 19436 Van Aken Blvd Unit 205
- 3139 Morley Rd
- 3103 Morley Rd
- 7 Shaker Glen Ln
- 6 Shaker Glen Ln
- 3157 Morley Rd
- 8 Shaker Glen Ln
- 4 Shaker Glen Ln
- 3075 Morley Rd
- 9 Shaker Glen Ln
- 3120 Morley Rd
- 3140 Morley Rd
- 3104 Morley Rd
- 20150 S Woodland Rd
- 11 Shaker Glen Ln
- 3175 Morley Rd
- 10 Shaker Glen Ln
- 3158 Morley Rd
- 12 Shaker Glen Ln
- 2 Shaker Glen Ln
- 3076 Morley Rd