Estimated Value: $224,000 - $261,000
--
Bed
2
Baths
1,541
Sq Ft
$157/Sq Ft
Est. Value
About This Home
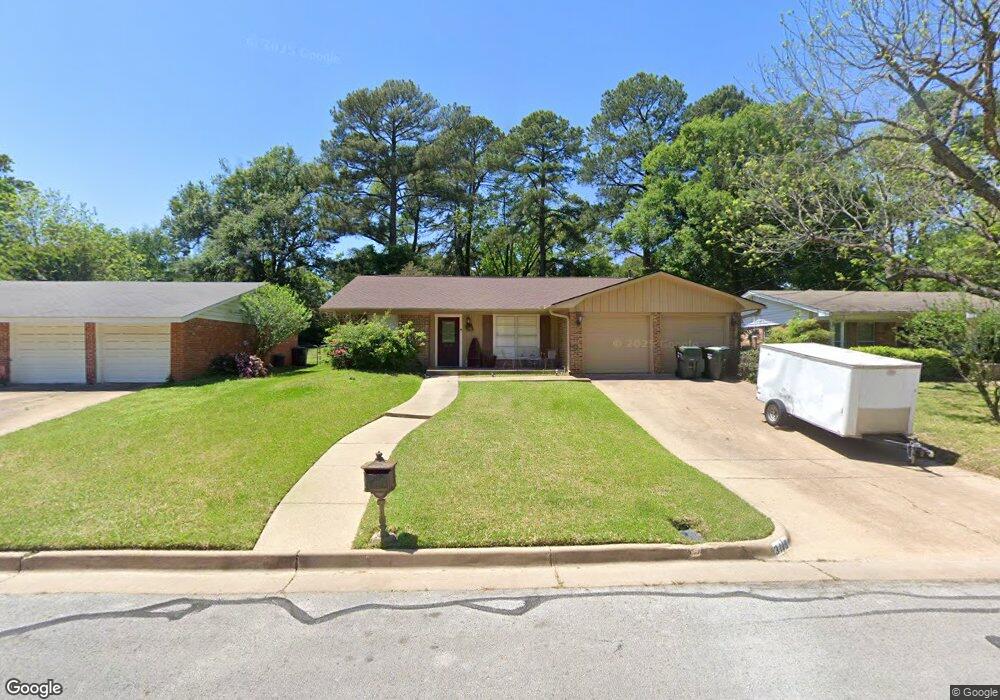
This home is located at 3119 Rosemary Ln, Tyler, TX 75701 and is currently estimated at $241,786, approximately $156 per square foot. 3119 Rosemary Ln is a home located in Smith County with nearby schools including Clarkston Elementary School, Hubbard Middle School, and Tyler Legacy High School.
Ownership History
Date
Name
Owned For
Owner Type
Purchase Details
Closed on
May 21, 2012
Sold by
Barrett Tracy L
Bought by
Burris Amy A
Current Estimated Value
Purchase Details
Closed on
Apr 26, 2011
Sold by
Krafve David William and Krafve Cathy A
Bought by
Barrett Tracy L and Burris Amy M
Home Financials for this Owner
Home Financials are based on the most recent Mortgage that was taken out on this home.
Original Mortgage
$136,451
Outstanding Balance
$96,828
Interest Rate
5.5%
Mortgage Type
FHA
Estimated Equity
$144,958
Purchase Details
Closed on
Jul 15, 2008
Sold by
Bellar Roger Wayne and Bellar Amelia Kay
Bought by
Krafve David William and Krafve Cathy A
Home Financials for this Owner
Home Financials are based on the most recent Mortgage that was taken out on this home.
Original Mortgage
$13,450
Interest Rate
6.4%
Mortgage Type
Stand Alone Second
Create a Home Valuation Report for This Property
The Home Valuation Report is an in-depth analysis detailing your home's value as well as a comparison with similar homes in the area
Home Values in the Area
Average Home Value in this Area
Purchase History
| Date | Buyer | Sale Price | Title Company |
|---|---|---|---|
| Burris Amy A | -- | None Available | |
| Barrett Tracy L | -- | None Available | |
| Krafve David William | -- | None Available |
Source: Public Records
Mortgage History
| Date | Status | Borrower | Loan Amount |
|---|---|---|---|
| Open | Barrett Tracy L | $136,451 | |
| Previous Owner | Krafve David William | $13,450 | |
| Previous Owner | Krafve David William | $108,000 | |
| Closed | Burris Amy A | $0 |
Source: Public Records
Tax History Compared to Growth
Tax History
| Year | Tax Paid | Tax Assessment Tax Assessment Total Assessment is a certain percentage of the fair market value that is determined by local assessors to be the total taxable value of land and additions on the property. | Land | Improvement |
|---|---|---|---|---|
| 2025 | $2,737 | $231,505 | $28,814 | $202,691 |
| 2024 | $2,737 | $217,547 | $19,224 | $205,103 |
| 2023 | $3,447 | $213,008 | $19,224 | $193,784 |
| 2022 | $3,522 | $186,750 | $19,224 | $167,526 |
| 2021 | $3,429 | $163,446 | $19,224 | $144,222 |
| 2020 | $3,203 | $149,672 | $19,224 | $130,448 |
| 2019 | $3,212 | $146,908 | $17,088 | $129,820 |
| 2018 | $3,312 | $152,265 | $14,632 | $137,633 |
| 2017 | $3,306 | $154,856 | $14,632 | $140,224 |
| 2016 | $3,135 | $146,860 | $14,632 | $132,228 |
| 2015 | $2,697 | $141,958 | $14,632 | $127,326 |
| 2014 | $2,697 | $138,073 | $14,632 | $123,441 |
Source: Public Records
Map
Nearby Homes
- 2827 Fairfax Dr
- 2631 Amy Ln
- 2902 Shenandoah Dr
- 2716 Roanoke Ln
- 3109 Campus Cir
- 2512 Alta Mira Dr
- 3108 Williamsburg Cir
- 2509 Delmar Dr
- 2523 Shenandoah Dr
- 2830 Juniper Ln
- 1920 McDonald Rd
- 2909 Meadowlark Ln
- 3801 Old Troup Hwy
- 2417 Riviera Dr
- 2958 Calloway Rd
- 3020 Meadowlark Ln
- 2226 Mimosa Dr
- 3205 Timberlane Dr
- 3401 Omega Dr
- 3107 Lake Vista Cir
- 3113 Rosemary Ln
- 3125 Rosemary Ln
- 3131 Rosemary Ln
- 3131 3131 Rosemary
- 3107 Rosemary Ln
- 3110 Norma Ln
- 3106 Norma Ln
- 3114 Norma Ln
- 3114 3114 Norma Ln
- 3106 3106 Norma Ln
- 3124 3124 Rosemary
- 3102 Norma Ln
- 3124 Rosemary Ln
- 3118 Rosemary Ln
- 3118 Norma Ln
- 3130 Rosemary Ln
- 3112 3112 Rosemary Ln
- 3112 Rosemary Ln
- 3101 Rosemary Ln