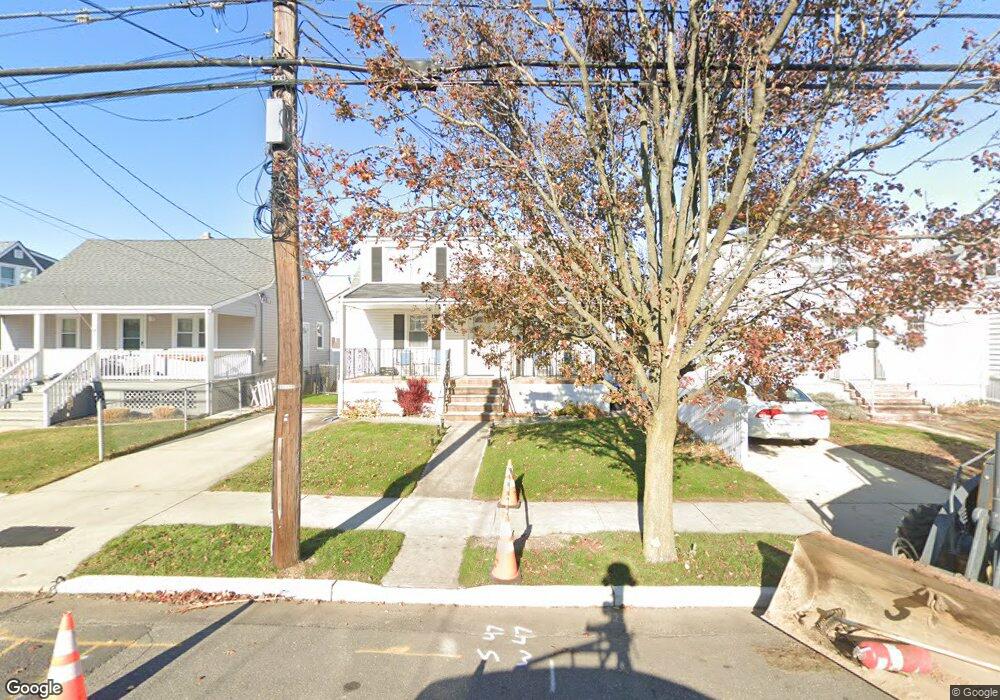
312 16th Ave Belmar, NJ 07719
Estimated Value: $608,000 - $1,185,000
4
Beds
2
Baths
1,292
Sq Ft
$718/Sq Ft
Est. Value
About This Home
This home is located at 312 16th Ave, Belmar, NJ 07719 and is currently estimated at $927,800, approximately $718 per square foot. 312 16th Ave is a home located in Monmouth County with nearby schools including Belmar Elementary School, St. Rose Grammar School, and St Rose High School.
Ownership History
Date
Name
Owned For
Owner Type
Purchase Details
Closed on
Mar 4, 2024
Sold by
Natoli Family Trust
Bought by
Nelson Marissa
Current Estimated Value
Home Financials for this Owner
Home Financials are based on the most recent Mortgage that was taken out on this home.
Original Mortgage
$300,000
Outstanding Balance
$294,982
Interest Rate
6.6%
Mortgage Type
New Conventional
Estimated Equity
$632,818
Purchase Details
Closed on
Dec 23, 2016
Sold by
Natoli Joan and Natoli Theodore Natoli
Bought by
Natoli Joan and Natoli Joseph E
Home Financials for this Owner
Home Financials are based on the most recent Mortgage that was taken out on this home.
Interest Rate
4.3%
Purchase Details
Closed on
Dec 16, 1997
Sold by
Tuzzio Dominick
Bought by
Natoli Theodore and Natoli Joan
Create a Home Valuation Report for This Property
The Home Valuation Report is an in-depth analysis detailing your home's value as well as a comparison with similar homes in the area
Home Values in the Area
Average Home Value in this Area
Purchase History
| Date | Buyer | Sale Price | Title Company |
|---|---|---|---|
| Nelson Marissa | $600,000 | Consumers Choice Title | |
| Nelson Marissa | $600,000 | Consumers Choice Title | |
| Natoli Joan | -- | -- | |
| Natoli Theodore | $159,000 | -- |
Source: Public Records
Mortgage History
| Date | Status | Borrower | Loan Amount |
|---|---|---|---|
| Open | Nelson Marissa | $300,000 | |
| Closed | Nelson Marissa | $300,000 | |
| Previous Owner | Natoli Joan | -- |
Source: Public Records
Tax History
| Year | Tax Paid | Tax Assessment Tax Assessment Total Assessment is a certain percentage of the fair market value that is determined by local assessors to be the total taxable value of land and additions on the property. | Land | Improvement |
|---|---|---|---|---|
| 2025 | $6,414 | $440,800 | $328,400 | $112,400 |
| 2024 | $6,198 | $440,800 | $328,400 | $112,400 |
| 2023 | $6,198 | $440,800 | $328,400 | $112,400 |
| 2022 | $5,518 | $440,800 | $328,400 | $112,400 |
| 2021 | $5,518 | $440,800 | $328,400 | $112,400 |
| 2020 | $5,929 | $440,800 | $328,400 | $112,400 |
| 2019 | $5,929 | $440,800 | $328,400 | $112,400 |
| 2018 | $5,444 | $440,800 | $328,400 | $112,400 |
| 2017 | $5,312 | $440,800 | $328,400 | $112,400 |
| 2016 | $5,551 | $290,500 | $183,400 | $107,100 |
| 2015 | $5,863 | $305,500 | $198,400 | $107,100 |
| 2014 | $5,524 | $285,500 | $178,400 | $107,100 |
Source: Public Records
Map
Nearby Homes
- 116 15th Ave
- 1203 D St
- 204 19th Ave
- 517 14th Ave
- 113 12th Ave
- 107 12th Ave
- 1304 Ocean Ave Unit 6A
- 107 18th Ave
- 520 18th Ave
- 503 11th Ave
- 105 11th Ave
- 1812 Fernwood Rd Unit 2
- 1809 Fernwood Rd
- 1850 Fernwood Rd
- 708 18th Ave
- 106 8th Ave
- 108 Howell Ave
- 1805 Margerum Ave
- 823 13th Ave
- 1000 River Rd Unit 7G
Your Personal Tour Guide
Ask me questions while you tour the home.