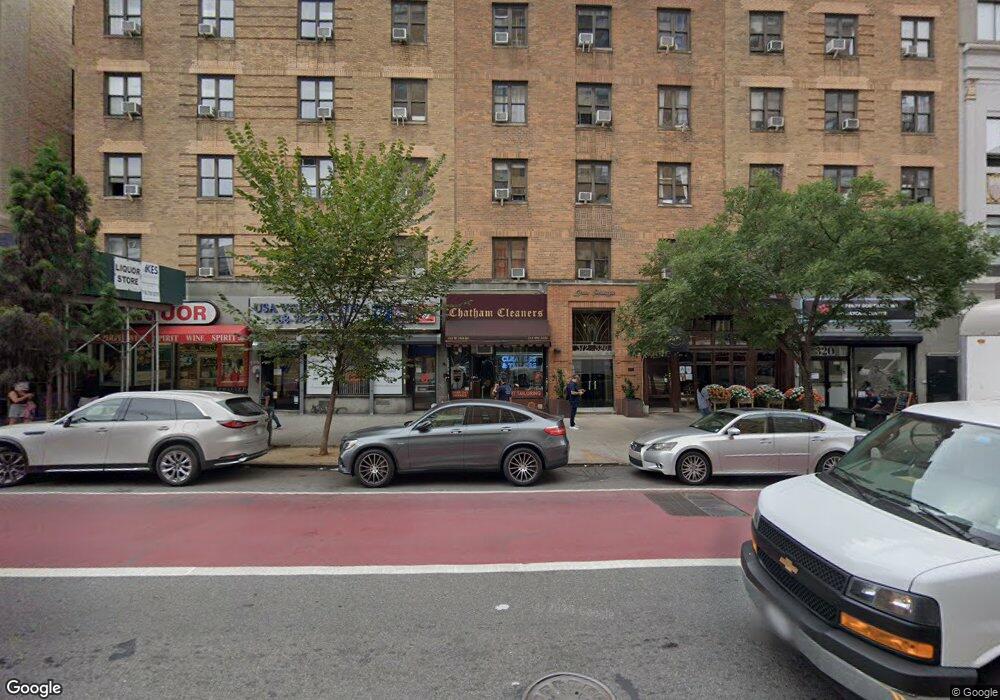
312-320 W 23rd St Unit 3F New York, NY 10011
Chelsea NeighborhoodEstimated Value: $513,368 - $703,000
--
Bed
--
Bath
330
Sq Ft
$1,762/Sq Ft
Est. Value
About This Home
This home is located at 312-320 W 23rd St Unit 3F, New York, NY 10011 and is currently estimated at $581,342, approximately $1,761 per square foot. 312-320 W 23rd St Unit 3F is a home located in New York County with nearby schools including P.S. 11 Sarah J. Garnet School, Clinton School, and Middle School 297.
Create a Home Valuation Report for This Property
The Home Valuation Report is an in-depth analysis detailing your home's value as well as a comparison with similar homes in the area
Home Values in the Area
Average Home Value in this Area
Tax History Compared to Growth
Tax History
| Year | Tax Paid | Tax Assessment Tax Assessment Total Assessment is a certain percentage of the fair market value that is determined by local assessors to be the total taxable value of land and additions on the property. | Land | Improvement |
|---|---|---|---|---|
| 2025 | $5,822 | $48,313 | $5,690 | $42,623 |
| 2024 | $5,822 | $46,566 | $5,690 | $40,876 |
| 2023 | $5,540 | $45,162 | $5,690 | $39,472 |
| 2022 | $5,334 | $45,187 | $5,690 | $39,497 |
| 2021 | $5,078 | $41,395 | $5,690 | $35,705 |
| 2020 | $5,170 | $45,930 | $5,690 | $40,240 |
| 2019 | $5,084 | $44,409 | $5,690 | $38,719 |
| 2018 | $4,919 | $41,062 | $5,690 | $35,372 |
| 2017 | $4,767 | $38,847 | $5,690 | $33,157 |
| 2016 | $4,737 | $37,004 | $5,690 | $31,314 |
| 2015 | $3,243 | $40,235 | $5,690 | $34,545 |
| 2014 | $3,243 | $36,256 | $5,690 | $30,566 |
Source: Public Records
Map
Nearby Homes
- 300 W 23rd St Unit 2K
- 300 W 23rd St Unit 4-L
- 300 W 23rd St Unit 11M
- 300 W 23rd St Unit 9D
- 315 W 23rd St Unit 10F
- 322 W 22nd St Unit 2
- 347 W 22nd St Unit 9
- 354 W 23rd St Unit GC
- 346 W 22nd St Unit 2
- 261 W 22nd St Unit 11
- 261 W 22nd St Unit 24/25/26
- 261 W 22nd St Unit 25/26
- 261 W 22nd St Unit 20
- 261 W 22nd St Unit 23
- 261 W 22nd St Unit 5
- 244 W 23rd St Unit 5B
- 244 W 23rd St Unit 3A
- 360 W 22nd St Unit 12B
- 255 W 23rd St Unit 5B
- 255 W 23rd St Unit 5GW
- 312 23 St Unit 3A
- 312 23 St Unit A
- 312 23 St
- 312-320 W 23rd St Unit 4P
- 312-320 W 23rd St Unit 1M
- 312-320 W 23rd St Unit 1E
- 312-320 W 23rd St Unit 3A
- 312-320 W 23rd St Unit 1U
- 312-320 W 23rd St Unit 3P
- 312-320 W 23rd St Unit 1T
- 312-320 W 23rd St Unit 2J
- 312-320 W 23rd St Unit 4F
- 312-320 W 23rd St Unit 2E
- 312-320 W 23rd St Unit 4T
- 312-320 W 23rd St Unit 4H
- 312-320 W 23rd St Unit 1J
- 312-320 W 23rd St Unit 3M
- 312-320 W 23rd St Unit 3J
- 312-320 W 23rd St Unit 2B
- 312-320 W 23rd St Unit 4M