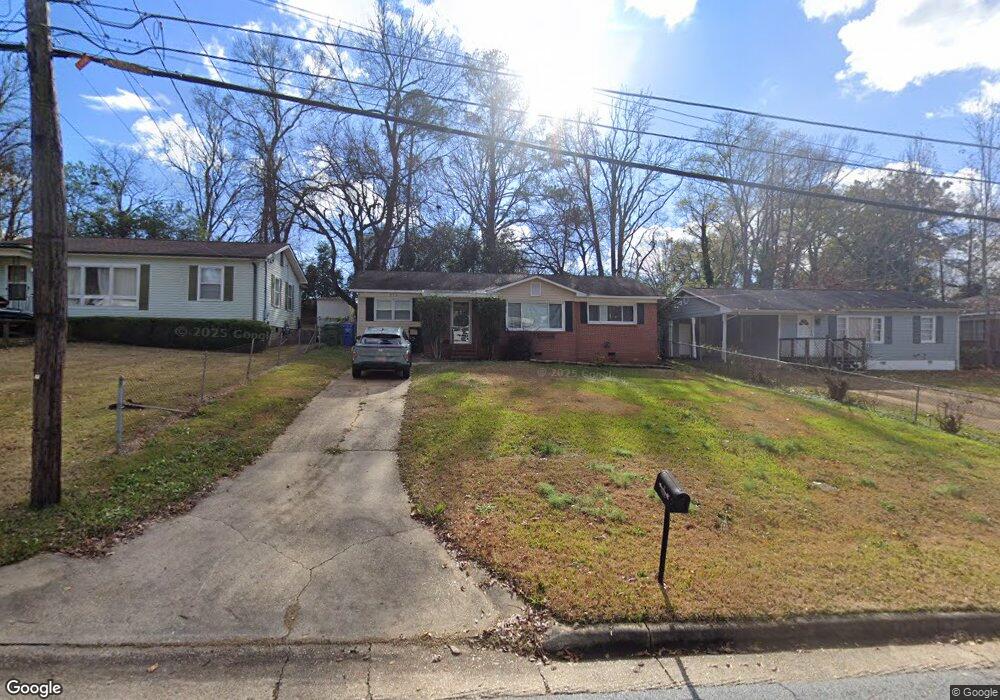
312 47th St Columbus, GA 31904
Northern Columbus NeighborhoodEstimated Value: $116,000 - $141,000
4
Beds
2
Baths
1,337
Sq Ft
$99/Sq Ft
Est. Value
About This Home
This home is located at 312 47th St, Columbus, GA 31904 and is currently estimated at $132,392, approximately $99 per square foot. 312 47th St is a home located in Muscogee County with nearby schools including River Road Elementary School, Double Churches Middle School, and Jordan Vocational High School.
Ownership History
Date
Name
Owned For
Owner Type
Purchase Details
Closed on
May 6, 2022
Sold by
Kavanagh Strategic Properties Llc
Bought by
Homeland Residential Fund 1 Llc
Current Estimated Value
Purchase Details
Closed on
Jan 28, 2022
Sold by
Davis Amanda B
Bought by
Kavanagh Strategic Properties Llc
Purchase Details
Closed on
Jun 1, 2016
Sold by
Porter Joseph Ryan
Bought by
Davis Amanda B
Home Financials for this Owner
Home Financials are based on the most recent Mortgage that was taken out on this home.
Original Mortgage
$80,882
Interest Rate
3.87%
Mortgage Type
FHA
Purchase Details
Closed on
Dec 30, 2013
Sold by
Milner Pamela H
Bought by
Porter Joseph Ryan
Home Financials for this Owner
Home Financials are based on the most recent Mortgage that was taken out on this home.
Original Mortgage
$65,600
Interest Rate
4.29%
Create a Home Valuation Report for This Property
The Home Valuation Report is an in-depth analysis detailing your home's value as well as a comparison with similar homes in the area
Home Values in the Area
Average Home Value in this Area
Purchase History
| Date | Buyer | Sale Price | Title Company |
|---|---|---|---|
| Homeland Residential Fund 1 Llc | $108,000 | None Listed On Document | |
| Kavanagh Strategic Properties Llc | $73,800 | None Listed On Document | |
| Davis Amanda B | $82,375 | -- | |
| Porter Joseph Ryan | $82,000 | -- |
Source: Public Records
Mortgage History
| Date | Status | Borrower | Loan Amount |
|---|---|---|---|
| Previous Owner | Davis Amanda B | $80,882 | |
| Previous Owner | Porter Joseph Ryan | $65,600 |
Source: Public Records
Tax History Compared to Growth
Tax History
| Year | Tax Paid | Tax Assessment Tax Assessment Total Assessment is a certain percentage of the fair market value that is determined by local assessors to be the total taxable value of land and additions on the property. | Land | Improvement |
|---|---|---|---|---|
| 2025 | $2,090 | $52,540 | $9,372 | $43,168 |
| 2024 | $2,065 | $52,540 | $9,372 | $43,168 |
| 2023 | $170 | $43,200 | $9,372 | $33,828 |
| 2022 | $1,286 | $31,504 | $7,028 | $24,476 |
| 2021 | $719 | $30,992 | $7,028 | $23,964 |
| 2020 | $719 | $30,992 | $7,028 | $23,964 |
| 2019 | $723 | $30,992 | $7,028 | $23,964 |
| 2018 | $723 | $30,992 | $7,028 | $23,964 |
| 2017 | $727 | $30,992 | $7,028 | $23,964 |
| 2016 | $806 | $32,800 | $2,640 | $30,160 |
| 2015 | $807 | $32,800 | $2,640 | $30,160 |
| 2014 | $809 | $32,800 | $2,640 | $30,160 |
| 2013 | -- | $31,153 | $2,640 | $28,513 |
Source: Public Records
Map
Nearby Homes