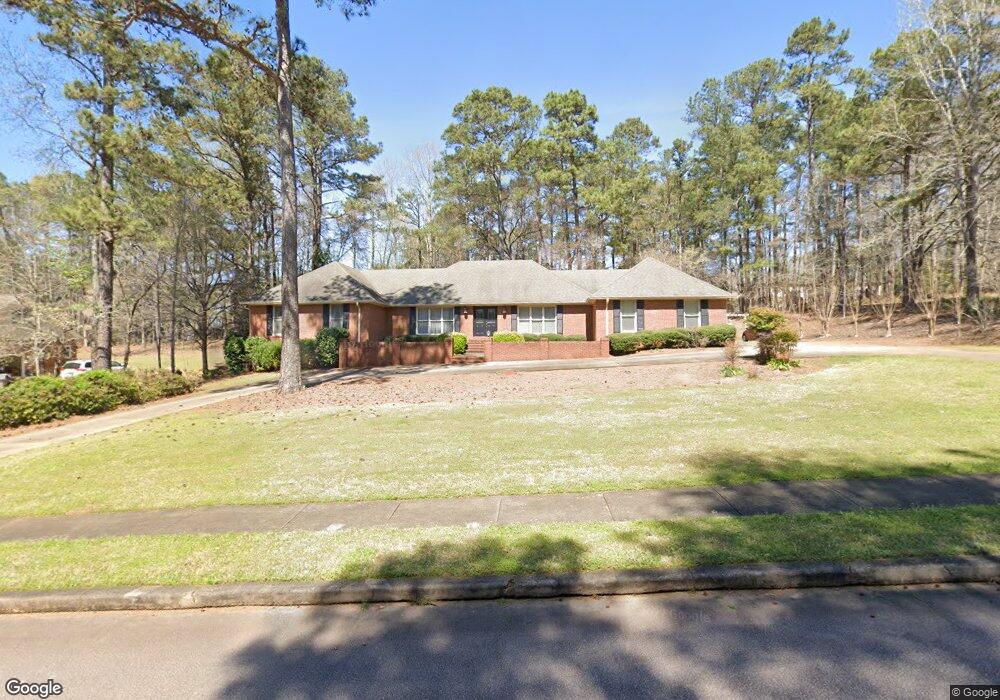
312 Ashford Cir Lagrange, GA 30240
Estimated Value: $372,159 - $434,000
4
Beds
3
Baths
2,783
Sq Ft
$147/Sq Ft
Est. Value
About This Home
This home is located at 312 Ashford Cir, Lagrange, GA 30240 and is currently estimated at $409,540, approximately $147 per square foot. 312 Ashford Cir is a home located in Troup County with nearby schools including Franklin Forest Elementary School, Hollis Hand Elementary School, and Ethel W. Kight Elementary School.
Ownership History
Date
Name
Owned For
Owner Type
Purchase Details
Closed on
Oct 17, 2019
Sold by
Belt Nancy
Bought by
Dobbins Deborah
Current Estimated Value
Purchase Details
Closed on
Jul 24, 2018
Sold by
Belt Nancy
Bought by
Belt Nancy and Dobbins Deborah
Purchase Details
Closed on
Jul 18, 2018
Sold by
Albert Aiken
Bought by
Belt Nancy
Purchase Details
Closed on
Jun 15, 2004
Sold by
Marion Louis Kirby Estate
Bought by
Aiken Albert
Purchase Details
Closed on
Jun 10, 2004
Sold by
Evelyn M Kirby
Bought by
Marion Louis Kirby Estate
Purchase Details
Closed on
Dec 7, 1998
Sold by
Deloach C
Bought by
Evelyn M Kirby
Purchase Details
Closed on
Nov 6, 1997
Sold by
Jo Ronald P and Jo Ann M Verner
Bought by
Deloach C
Purchase Details
Closed on
Dec 20, 1988
Sold by
West Ga Estates Inc
Bought by
Jo Ronald P and Jo Ann M Verner
Purchase Details
Closed on
Jun 14, 1985
Sold by
Heinrich J Boggess
Bought by
West Ga Estates Inc
Create a Home Valuation Report for This Property
The Home Valuation Report is an in-depth analysis detailing your home's value as well as a comparison with similar homes in the area
Home Values in the Area
Average Home Value in this Area
Purchase History
| Date | Buyer | Sale Price | Title Company |
|---|---|---|---|
| Dobbins Deborah | -- | -- | |
| Belt Nancy | -- | -- | |
| Belt Nancy | $235,000 | -- | |
| Aiken Albert | -- | -- | |
| Marion Louis Kirby Estate | $237,000 | -- | |
| Evelyn M Kirby | $195,000 | -- | |
| Deloach C | $164,000 | -- | |
| Jo Ronald P | $29,500 | -- | |
| West Ga Estates Inc | -- | -- |
Source: Public Records
Tax History Compared to Growth
Tax History
| Year | Tax Paid | Tax Assessment Tax Assessment Total Assessment is a certain percentage of the fair market value that is determined by local assessors to be the total taxable value of land and additions on the property. | Land | Improvement |
|---|---|---|---|---|
| 2024 | $3,472 | $129,280 | $18,000 | $111,280 |
| 2023 | $2,587 | $114,760 | $14,000 | $100,760 |
| 2022 | $3,008 | $109,760 | $14,000 | $95,760 |
| 2021 | $2,809 | $95,120 | $14,000 | $81,120 |
| 2020 | $2,809 | $95,120 | $14,000 | $81,120 |
| 2019 | $2,775 | $96,720 | $14,000 | $82,720 |
| 2018 | $2,857 | $96,720 | $14,000 | $82,720 |
| 2017 | $2,857 | $96,720 | $14,000 | $82,720 |
| 2016 | $2,834 | $95,942 | $14,000 | $81,942 |
| 2015 | $2,839 | $95,942 | $14,000 | $81,942 |
| 2014 | $2,792 | $94,252 | $14,000 | $80,252 |
| 2013 | -- | $95,408 | $14,000 | $81,408 |
Source: Public Records
Map
Nearby Homes
- 105 Ridgeview Dr
- 104 Hidden Branches Ln
- 118 Moss Creek Dr
- 127 Oakmont Dr
- 127 Ashling Dr
- 107 Windridge
- LOT 106 River Oaks Dr
- 109 Windridge
- 117 Woodchase
- 209 River Oaks Dr
- 129 Sunny Point Cir
- 91 Richmond Dr
- 1784 New Franklin Rd
- 100 Creekside Dr Unit LOT 60A
- 107 Dixie Creek Dr
- 89 Chase Rd
- 106 S Chilton Crescent
- 203 S Chilton Crescent
- 201 S Chilton Crescent
- 106 Highland Park
- 310 Ashford Cir
- 314 Ashford Cir
- 103 Saint Angela Merici Ct
- 101 Saint Angela Merici Ct
- 313 Ashford Cir
- 105 St Angela Merici Ct
- 311 Ashford Cir
- 105 Saint Angela Merici Ct
- 308 Ashford Cir
- 316 Ashford Cir
- 309 Ashford Cir
- 315 Ashford Cir
- 230 Ashford Cir
- 107 Saint Angela Merici Ct
- 102 Saint Angela Merici Ct
- 104 St Angela Merici
- 104 Saint Angela Merici Ct
- 215 Northridge Dr
- 401 Ashford Cir
- 119 Lismore Dr