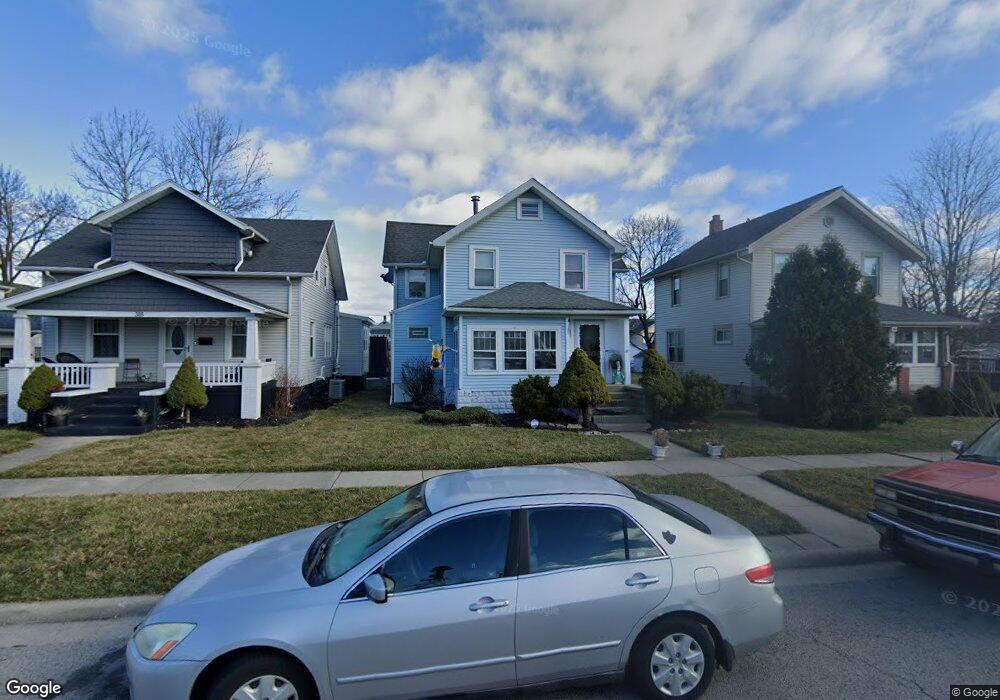
312 Baldwin Ave Findlay, OH 45840
Estimated Value: $186,315 - $246,000
4
Beds
2
Baths
1,614
Sq Ft
$133/Sq Ft
Est. Value
About This Home
This home is located at 312 Baldwin Ave, Findlay, OH 45840 and is currently estimated at $215,079, approximately $133 per square foot. 312 Baldwin Ave is a home located in Hancock County with nearby schools including Lincoln Elementary School, Donnell Middle School, and Findlay High School.
Ownership History
Date
Name
Owned For
Owner Type
Purchase Details
Closed on
Feb 20, 2004
Sold by
Fink Kurt F and Fink Karen Mary
Bought by
White Brian S and Warner Teresa M
Current Estimated Value
Home Financials for this Owner
Home Financials are based on the most recent Mortgage that was taken out on this home.
Original Mortgage
$122,455
Outstanding Balance
$57,072
Interest Rate
5.74%
Mortgage Type
Purchase Money Mortgage
Estimated Equity
$158,007
Purchase Details
Closed on
Oct 29, 1996
Sold by
Miller Kenneth
Bought by
Fink Kurt and Fink Karen
Home Financials for this Owner
Home Financials are based on the most recent Mortgage that was taken out on this home.
Original Mortgage
$84,550
Interest Rate
8.32%
Mortgage Type
New Conventional
Purchase Details
Closed on
Jul 1, 1991
Bought by
Miller Kenneth E and Miller Rebekah
Purchase Details
Closed on
May 2, 1988
Bought by
Below Martha Jane
Purchase Details
Closed on
Apr 1, 1981
Bought by
Below Timothy A and Below Martha J
Create a Home Valuation Report for This Property
The Home Valuation Report is an in-depth analysis detailing your home's value as well as a comparison with similar homes in the area
Home Values in the Area
Average Home Value in this Area
Purchase History
| Date | Buyer | Sale Price | Title Company |
|---|---|---|---|
| White Brian S | $128,900 | -- | |
| Fink Kurt | $89,000 | -- | |
| Miller Kenneth E | $56,500 | -- | |
| Below Martha Jane | -- | -- | |
| Below Timothy A | -- | -- |
Source: Public Records
Mortgage History
| Date | Status | Borrower | Loan Amount |
|---|---|---|---|
| Open | White Brian S | $122,455 | |
| Closed | Fink Kurt | $84,550 |
Source: Public Records
Tax History
| Year | Tax Paid | Tax Assessment Tax Assessment Total Assessment is a certain percentage of the fair market value that is determined by local assessors to be the total taxable value of land and additions on the property. | Land | Improvement |
|---|---|---|---|---|
| 2024 | $1,791 | $50,420 | $6,130 | $44,290 |
| 2023 | $1,794 | $50,420 | $6,130 | $44,290 |
| 2022 | $1,788 | $50,420 | $6,130 | $44,290 |
| 2021 | $1,691 | $41,550 | $6,280 | $35,270 |
| 2020 | $1,691 | $41,550 | $6,280 | $35,270 |
| 2019 | $1,657 | $41,550 | $6,280 | $35,270 |
| 2018 | $1,555 | $35,740 | $4,420 | $31,320 |
| 2017 | $1,554 | $35,740 | $4,420 | $31,320 |
| 2016 | $1,537 | $35,740 | $4,420 | $31,320 |
| 2015 | $1,102 | $25,210 | $3,790 | $21,420 |
| 2014 | $1,102 | $25,210 | $3,790 | $21,420 |
| 2012 | $1,113 | $25,210 | $3,790 | $21,420 |
Source: Public Records
Map
Nearby Homes
- 1113 Hurd Ave
- 423 Elm St
- 324 W Mcpherson Ave
- 412 Lima Ave
- 416 1/2 Lima Ave
- 1304 Douglas Pkwy
- 860 Hurd Ave
- 123 Glendale Ave
- 845 Hurd Ave
- 865 S Main St
- 216 1st St
- 206 Greenlawn Ave
- 829 Maple Ave
- 514 Liberty St
- 315 Fairlawn Place
- 527 W Sandusky St
- 400 E Pearl St
- 731 5th St
- 136 E Hobart Ave
- 1604 Gray St
- 318 Baldwin Ave
- 308 Baldwin Ave
- 300 Baldwin Ave
- 1124 S West St
- 1120 S West St
- 230 Baldwin Ave
- 322 Baldwin Ave
- 1125 S West St
- 228 Baldwin Ave
- 1112 S West St
- 1121 Liberty St Unit R
- 1121 Liberty St
- 1117 S West St
- 226 Baldwin Ave
- 1106 S West St
- 1115 S West St
- 323 Baldwin Ave
- 307 Locust St
- 311 Locust St
- 315 Locust St
Your Personal Tour Guide
Ask me questions while you tour the home.