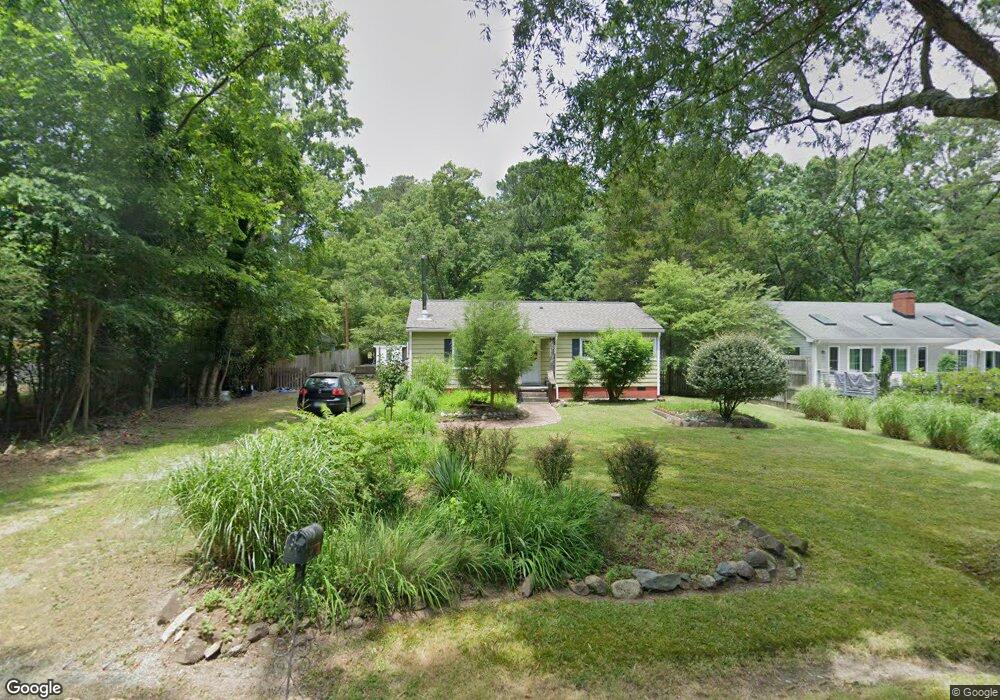
312 Barclay Rd Chapel Hill, NC 27516
Estimated Value: $380,000 - $502,000
3
Beds
1
Bath
1,080
Sq Ft
$385/Sq Ft
Est. Value
About This Home
This home is located at 312 Barclay Rd, Chapel Hill, NC 27516 and is currently estimated at $415,884, approximately $385 per square foot. 312 Barclay Rd is a home located in Orange County with nearby schools including Smith Middle School, Chapel Hill High School, and St. Thomas More Catholic School.
Ownership History
Date
Name
Owned For
Owner Type
Purchase Details
Closed on
Oct 13, 2008
Sold by
Bruder Anne Lindsey
Bought by
Flaxman Gregory Marc
Current Estimated Value
Home Financials for this Owner
Home Financials are based on the most recent Mortgage that was taken out on this home.
Original Mortgage
$208,000
Outstanding Balance
$137,717
Interest Rate
6.34%
Mortgage Type
Purchase Money Mortgage
Estimated Equity
$278,167
Purchase Details
Closed on
Feb 25, 2005
Sold by
Sica Joseph H
Bought by
Flaxman Gregory Marc and Bruder Anne Lindsey
Home Financials for this Owner
Home Financials are based on the most recent Mortgage that was taken out on this home.
Original Mortgage
$194,400
Interest Rate
4.25%
Mortgage Type
Fannie Mae Freddie Mac
Purchase Details
Closed on
Jan 4, 2005
Sold by
Hill Mark W
Bought by
Sica Joseph H
Home Financials for this Owner
Home Financials are based on the most recent Mortgage that was taken out on this home.
Original Mortgage
$194,400
Interest Rate
4.25%
Mortgage Type
Fannie Mae Freddie Mac
Purchase Details
Closed on
Aug 10, 2001
Sold by
Betts Wiley Forbus and Betts Robin Rancer
Bought by
Hill Mark W
Home Financials for this Owner
Home Financials are based on the most recent Mortgage that was taken out on this home.
Original Mortgage
$143,000
Interest Rate
7.1%
Create a Home Valuation Report for This Property
The Home Valuation Report is an in-depth analysis detailing your home's value as well as a comparison with similar homes in the area
Home Values in the Area
Average Home Value in this Area
Purchase History
| Date | Buyer | Sale Price | Title Company |
|---|---|---|---|
| Flaxman Gregory Marc | -- | None Available | |
| Flaxman Gregory Marc | $216,000 | -- | |
| Sica Joseph H | -- | -- | |
| Hill Mark W | $148,500 | -- |
Source: Public Records
Mortgage History
| Date | Status | Borrower | Loan Amount |
|---|---|---|---|
| Open | Flaxman Gregory Marc | $208,000 | |
| Previous Owner | Flaxman Gregory Marc | $194,400 | |
| Previous Owner | Hill Mark W | $143,000 |
Source: Public Records
Tax History Compared to Growth
Tax History
| Year | Tax Paid | Tax Assessment Tax Assessment Total Assessment is a certain percentage of the fair market value that is determined by local assessors to be the total taxable value of land and additions on the property. | Land | Improvement |
|---|---|---|---|---|
| 2025 | $5,337 | $391,700 | $250,000 | $141,700 |
| 2024 | $4,425 | $250,900 | $140,000 | $110,900 |
| 2023 | $4,310 | $250,900 | $140,000 | $110,900 |
| 2022 | $4,136 | $250,900 | $140,000 | $110,900 |
| 2021 | $4,085 | $250,900 | $140,000 | $110,900 |
| 2020 | $3,605 | $205,900 | $100,000 | $105,900 |
| 2018 | $3,514 | $205,900 | $100,000 | $105,900 |
| 2017 | $3,345 | $205,900 | $100,000 | $105,900 |
| 2016 | $3,345 | $194,585 | $96,649 | $97,936 |
| 2015 | $3,345 | $194,585 | $96,649 | $97,936 |
| 2014 | $3,300 | $194,585 | $96,649 | $97,936 |
Source: Public Records
Map
Nearby Homes
- 220 Barclay Rd
- 500 Umstead Dr Unit 304
- 500 Umstead Dr Unit 103
- 500 Umstead Dr Unit D307
- 500 Umstead Dr Unit D308
- 126 Barclay Rd
- 104 Woodleaf Dr
- 221 Ironwoods Dr
- 116 Justice St
- 105 Oldham Place
- 219 Columbia Place W
- 4 Bolin Heights
- 107 Hillcrest Ave Unit C & D
- 240 Jay St
- 620 Martin Luther King jr Blvd Unit 602
- 316 Brooks St
- 1530 Pathway Dr
- 511 Hillsborough St Unit 106
- 503 Edwards Dr
- 107 Mulberry St Unit B