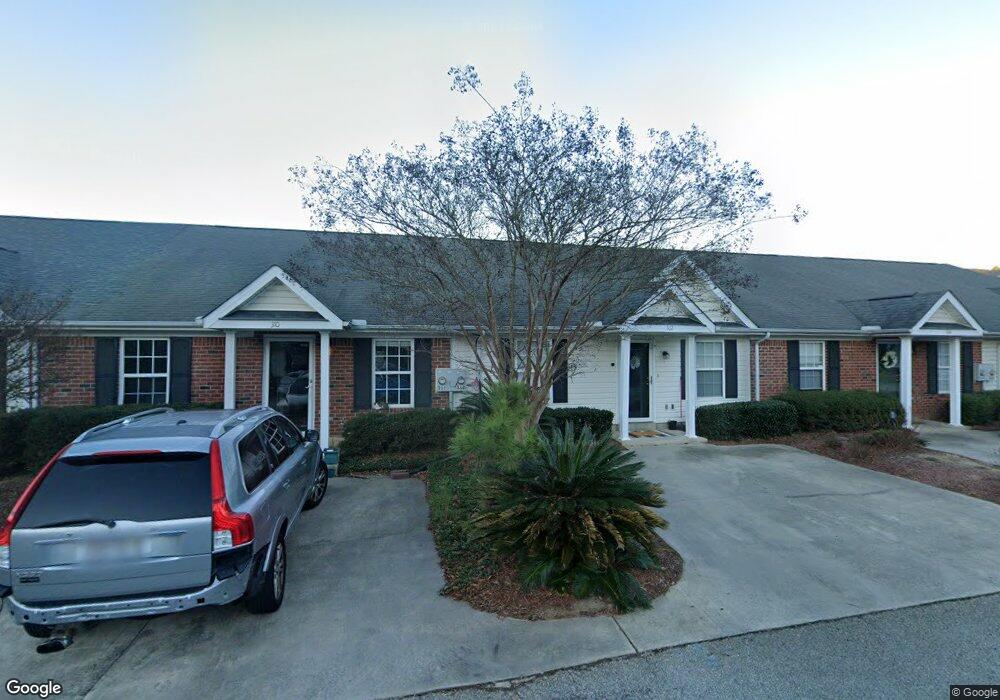
312 Beech Ln Grovetown, GA 30813
Estimated Value: $162,000 - $168,000
2
Beds
2
Baths
1,092
Sq Ft
$151/Sq Ft
Est. Value
About This Home
This home is located at 312 Beech Ln, Grovetown, GA 30813 and is currently estimated at $165,148, approximately $151 per square foot. 312 Beech Ln is a home located in Columbia County with nearby schools including Northboro Elementary School, Brookwood Elementary School, and Columbia Middle School.
Ownership History
Date
Name
Owned For
Owner Type
Purchase Details
Closed on
Apr 23, 2021
Sold by
Johnson Ralph
Bought by
Clements Tiffany Lynn
Current Estimated Value
Home Financials for this Owner
Home Financials are based on the most recent Mortgage that was taken out on this home.
Original Mortgage
$117,826
Outstanding Balance
$106,552
Interest Rate
3.1%
Mortgage Type
FHA
Estimated Equity
$58,596
Purchase Details
Closed on
Oct 24, 2008
Sold by
Sorapuru Angela Stiger
Bought by
Johnson Ralph
Home Financials for this Owner
Home Financials are based on the most recent Mortgage that was taken out on this home.
Original Mortgage
$90,035
Interest Rate
6.11%
Mortgage Type
FHA
Purchase Details
Closed on
Jan 30, 2004
Sold by
Belair Ridge Llc
Bought by
Stiger Angela N
Home Financials for this Owner
Home Financials are based on the most recent Mortgage that was taken out on this home.
Original Mortgage
$72,364
Interest Rate
5.77%
Mortgage Type
FHA
Create a Home Valuation Report for This Property
The Home Valuation Report is an in-depth analysis detailing your home's value as well as a comparison with similar homes in the area
Home Values in the Area
Average Home Value in this Area
Purchase History
| Date | Buyer | Sale Price | Title Company |
|---|---|---|---|
| Clements Tiffany Lynn | $120,000 | -- | |
| Johnson Ralph | $91,000 | -- | |
| Stiger Angela N | $73,500 | -- |
Source: Public Records
Mortgage History
| Date | Status | Borrower | Loan Amount |
|---|---|---|---|
| Open | Clements Tiffany Lynn | $117,826 | |
| Previous Owner | Johnson Ralph | $90,035 | |
| Previous Owner | Stiger Angela N | $72,364 |
Source: Public Records
Tax History Compared to Growth
Tax History
| Year | Tax Paid | Tax Assessment Tax Assessment Total Assessment is a certain percentage of the fair market value that is determined by local assessors to be the total taxable value of land and additions on the property. | Land | Improvement |
|---|---|---|---|---|
| 2025 | $1,443 | $62,484 | $12,304 | $50,180 |
| 2024 | $1,469 | $60,766 | $11,604 | $49,162 |
| 2023 | $1,469 | $57,630 | $11,604 | $46,026 |
| 2022 | $1,196 | $48,000 | $9,560 | $38,440 |
| 2021 | $1,076 | $41,529 | $8,904 | $32,625 |
| 2020 | $1,020 | $38,684 | $7,604 | $31,080 |
| 2019 | $903 | $34,496 | $7,004 | $27,492 |
| 2018 | $826 | $31,584 | $6,504 | $25,080 |
| 2017 | $842 | $32,038 | $6,704 | $25,334 |
| 2016 | $839 | $33,126 | $6,880 | $26,246 |
| 2015 | $725 | $28,847 | $6,180 | $22,667 |
| 2014 | $786 | $30,760 | $6,180 | $24,580 |
Source: Public Records
Map
Nearby Homes
- 591 Old Wheeler Rd
- 1447 Collins Dr
- 706 Muscadine Ct
- 4456 Wrightsboro Rd
- 167 S Old Belair Rd
- 4413 Wrightsboro Rd
- 4593 Millhaven Rd
- 606 Todd Rd
- 704 Leela Ct
- 4737 W Creek Mill Ct
- 349 Westmont Dr
- 443 S Old Belair Rd
- 2210 Jasmine Way
- 2912 Palmetto Dr
- 2222 Jasmine Way
- 2207 Jasmine Way
- 2209 Jasmine Way
- 340 Colonial Ct
- 2215 Jasmine Way
- 2221 Jasmine Way