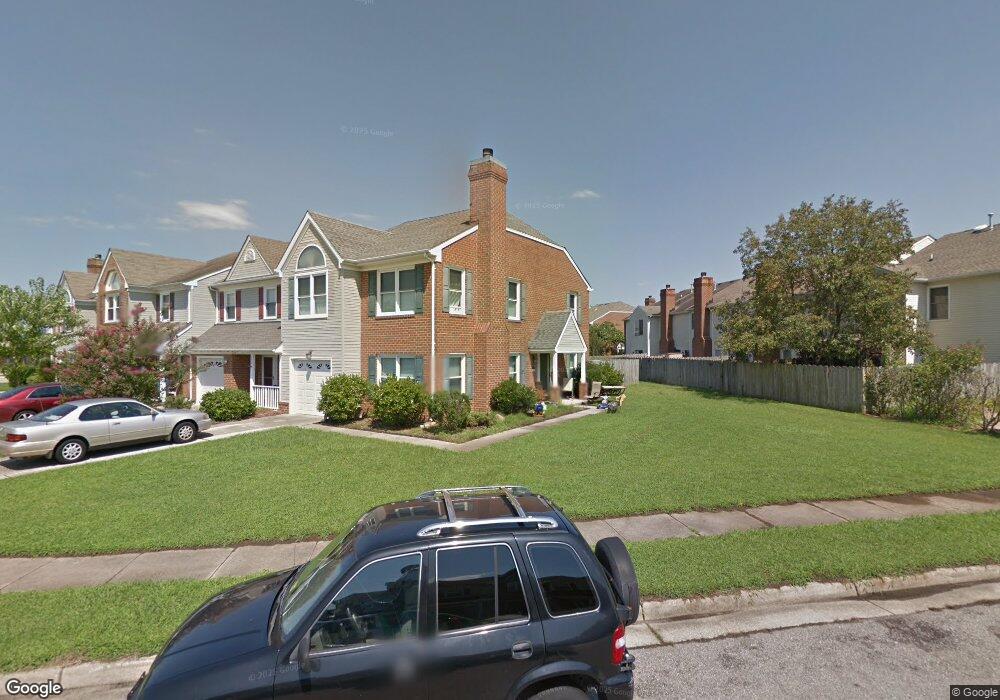
312 Brisa Dr Chesapeake, VA 23322
Great Bridge NeighborhoodEstimated Value: $344,000 - $382,192
3
Beds
3
Baths
1,872
Sq Ft
$195/Sq Ft
Est. Value
About This Home
This home is located at 312 Brisa Dr, Chesapeake, VA 23322 and is currently estimated at $364,298, approximately $194 per square foot. 312 Brisa Dr is a home located in Chesapeake City with nearby schools including Cedar Road Elementary School, Great Bridge Middle School, and Grassfield High School.
Ownership History
Date
Name
Owned For
Owner Type
Purchase Details
Closed on
Jul 14, 2021
Sold by
Rheinholtz Rachel A
Bought by
White Nathan and White Samantha
Current Estimated Value
Home Financials for this Owner
Home Financials are based on the most recent Mortgage that was taken out on this home.
Original Mortgage
$296,670
Outstanding Balance
$269,182
Interest Rate
2.9%
Mortgage Type
VA
Estimated Equity
$95,116
Purchase Details
Closed on
Nov 29, 2017
Sold by
Moy Michael D and Moy Brandy
Bought by
Rheinholtz Rachel A
Home Financials for this Owner
Home Financials are based on the most recent Mortgage that was taken out on this home.
Original Mortgage
$222,095
Interest Rate
3.94%
Mortgage Type
VA
Purchase Details
Closed on
Dec 29, 2009
Sold by
Eubanks Paul W
Bought by
Moy Michael D
Home Financials for this Owner
Home Financials are based on the most recent Mortgage that was taken out on this home.
Original Mortgage
$192,307
Interest Rate
4.87%
Mortgage Type
FHA
Create a Home Valuation Report for This Property
The Home Valuation Report is an in-depth analysis detailing your home's value as well as a comparison with similar homes in the area
Home Values in the Area
Average Home Value in this Area
Purchase History
| Date | Buyer | Sale Price | Title Company |
|---|---|---|---|
| White Nathan | $290,000 | Attorney | |
| Rheinholtz Rachel A | $215,000 | Attorney | |
| Moy Michael D | $210,000 | -- |
Source: Public Records
Mortgage History
| Date | Status | Borrower | Loan Amount |
|---|---|---|---|
| Open | White Nathan | $296,670 | |
| Previous Owner | Rheinholtz Rachel A | $222,095 | |
| Previous Owner | Moy Michael D | $192,307 |
Source: Public Records
Tax History Compared to Growth
Tax History
| Year | Tax Paid | Tax Assessment Tax Assessment Total Assessment is a certain percentage of the fair market value that is determined by local assessors to be the total taxable value of land and additions on the property. | Land | Improvement |
|---|---|---|---|---|
| 2025 | $3,399 | $355,200 | $120,000 | $235,200 |
| 2024 | $3,399 | $336,500 | $110,000 | $226,500 |
| 2023 | $2,778 | $296,000 | $95,000 | $201,000 |
| 2022 | $2,831 | $280,300 | $80,000 | $200,300 |
| 2021 | $1,862 | $234,400 | $70,000 | $164,400 |
| 2020 | $2,363 | $225,000 | $70,000 | $155,000 |
| 2019 | $2,275 | $216,700 | $55,000 | $161,700 |
| 2018 | $2,262 | $215,400 | $55,000 | $160,400 |
| 2017 | $2,199 | $209,400 | $50,000 | $159,400 |
| 2016 | $2,075 | $197,600 | $50,000 | $147,600 |
| 2015 | $2,017 | $192,100 | $50,000 | $142,100 |
| 2014 | $1,973 | $187,900 | $50,000 | $137,900 |
Source: Public Records
Map
Nearby Homes
- 724 Brisa Ct
- 303 Sherwood Forest Rd
- 504 Landmark Ct
- 902 Summerfield Crescent
- 501 Landmark Ct
- 406 Whisper Walk
- 1312 False Creek Way
- 328 San Roman Dr
- 1000 Fox Ridge Ct
- 424 Galies Pointe Ln
- 1332 Club House Dr
- 924 Fox Ridge Trail
- 832 Doe Run Dr
- 510 San Pedro Dr
- 1141 Eagle Pointe Way
- 1161 Bells Mill Rd
- 329 Barcelona Dr
- 428 Moores Landing
- 405 Beacon Key Ct
- 704 Washington Dr