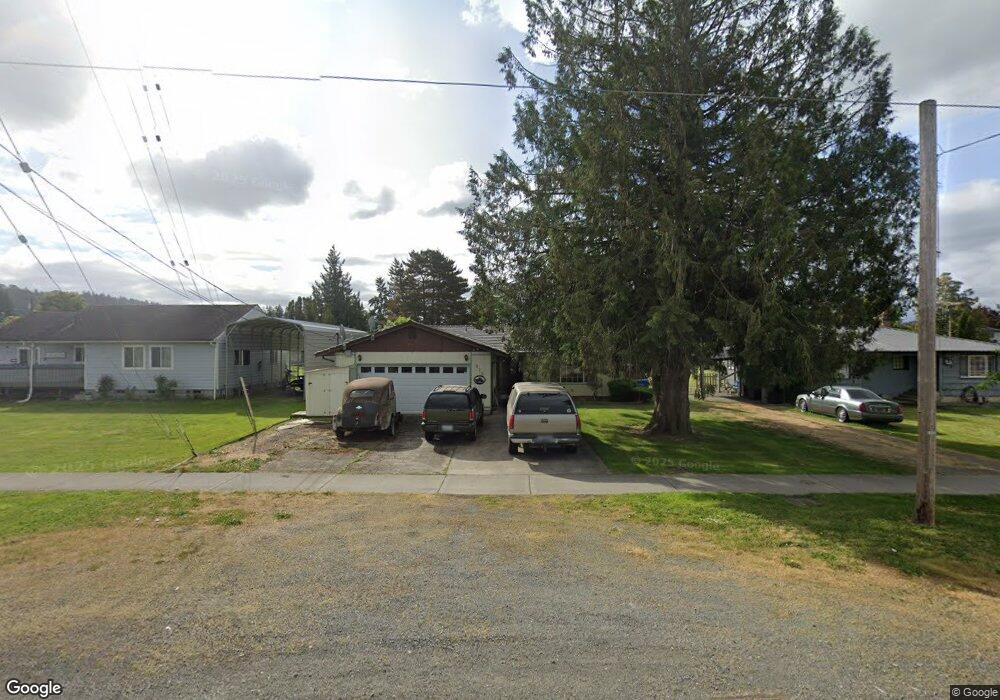
312 Calistoga St W Orting, WA 98360
Estimated Value: $306,000 - $391,000
1
Bed
1
Bath
724
Sq Ft
$478/Sq Ft
Est. Value
About This Home
This home is located at 312 Calistoga St W, Orting, WA 98360 and is currently estimated at $346,434, approximately $478 per square foot. 312 Calistoga St W is a home located in Pierce County with nearby schools including Orting Elementary School, Ptarmigan Ridge Elementary School, and Orting Middle School.
Ownership History
Date
Name
Owned For
Owner Type
Purchase Details
Closed on
Nov 13, 2023
Sold by
Wytko Kyla M
Bought by
Home Megan and Home-Smith Zachary
Current Estimated Value
Home Financials for this Owner
Home Financials are based on the most recent Mortgage that was taken out on this home.
Original Mortgage
$308,750
Outstanding Balance
$302,460
Interest Rate
7.63%
Mortgage Type
New Conventional
Estimated Equity
$43,974
Purchase Details
Closed on
Dec 31, 2012
Sold by
Magstadt Ron and Magstadt Marilyn
Bought by
Bates Chester P and Kent Stacie
Purchase Details
Closed on
Mar 26, 2004
Sold by
Bates Chester P and Kent Stacie
Bought by
Wytko Kyla M
Home Financials for this Owner
Home Financials are based on the most recent Mortgage that was taken out on this home.
Original Mortgage
$227,475
Interest Rate
3.4%
Mortgage Type
FHA
Purchase Details
Closed on
Mar 21, 1996
Sold by
Sessions G P and Schrader Albert H
Bought by
Bates Richard E and Bates Clara M
Create a Home Valuation Report for This Property
The Home Valuation Report is an in-depth analysis detailing your home's value as well as a comparison with similar homes in the area
Home Values in the Area
Average Home Value in this Area
Purchase History
| Date | Buyer | Sale Price | Title Company |
|---|---|---|---|
| Home Megan | $325,000 | Chicago Title | |
| Bates Chester P | -- | None Available | |
| Wytko Kyla M | $231,672 | Chicago Title | |
| Bates Richard E | $60,000 | -- |
Source: Public Records
Mortgage History
| Date | Status | Borrower | Loan Amount |
|---|---|---|---|
| Open | Home Megan | $308,750 | |
| Previous Owner | Wytko Kyla M | $9,099 | |
| Previous Owner | Wytko Kyla M | $227,475 |
Source: Public Records
Tax History
| Year | Tax Paid | Tax Assessment Tax Assessment Total Assessment is a certain percentage of the fair market value that is determined by local assessors to be the total taxable value of land and additions on the property. | Land | Improvement |
|---|---|---|---|---|
| 2025 | $2,398 | $285,900 | $186,300 | $99,600 |
| 2024 | $2,398 | $276,700 | $176,500 | $100,200 |
| 2023 | $2,398 | $260,000 | $168,700 | $91,300 |
| 2022 | $2,296 | $265,700 | $168,700 | $97,000 |
| 2021 | $2,220 | $183,000 | $111,200 | $71,800 |
| 2019 | $1,901 | $161,100 | $94,300 | $66,800 |
| 2018 | $1,905 | $147,200 | $82,200 | $65,000 |
| 2017 | $1,697 | $126,100 | $66,000 | $60,100 |
| 2016 | $1,532 | $100,000 | $52,100 | $47,900 |
| 2014 | $630 | $91,300 | $46,500 | $44,800 |
| 2013 | $630 | $74,500 | $36,600 | $37,900 |
Source: Public Records
Map
Nearby Homes
- 121 van Scoyoc Ave SW
- 120 Corrin Ave NW
- 213 Bridge St SW
- 211 Bridge St SW
- 215 Corrin Ave NW Unit C
- 215 Corrin Ave NW Unit B
- 215 Corrin Ave NW Unit D
- 215 Corrin Ave NW Unit A
- 310 Orting Ave NW
- 718 Teetor Cir NW Unit LOT 9
- 716 Teetor Cir NW Unit Lot 08
- 304 Varner Ave SE
- 722 Teetor Cir NW Unit Lot 11
- 724 Teetor Cir NW Unit LOT 12
- 317 Icey St SW
- 710 Teetor Cir NW
- 710 Teetor Cir NW Unit LOT 5
- 726 Teetor Cir NW Unit Lot 13
- 734 Teetor Cir NW Unit Lot 33
- 708 Teetor Cir NW Unit LOT 4
- 308 Calistoga St W
- 314 Calistoga St W
- 112 Tacoma Ave S
- 306 Calistoga St W
- 318 Calistoga St W
- 313 Calistoga St W
- 304 Calistoga St W
- 111 Eldredge Ave NW
- 115 Eldredge Ave SW
- 110 Tacoma Ave SW
- 121 Kensington Ave SW Unit 1-10
- 121 Kensington Ave SW
- 309 Calistoga St W
- 110 Tacoma Ave S
- 109 Eldredge Ave SW
- 307 Calistoga St W
- 302 Calistoga St W
- 305 Calistoga St W
- 305 Calistoga St W Unit 1 & 2
- 106 Tacoma Ave S
Your Personal Tour Guide
Ask me questions while you tour the home.