Estimated Value: $90,759 - $128,000
2
Beds
1
Bath
816
Sq Ft
$129/Sq Ft
Est. Value
About This Home
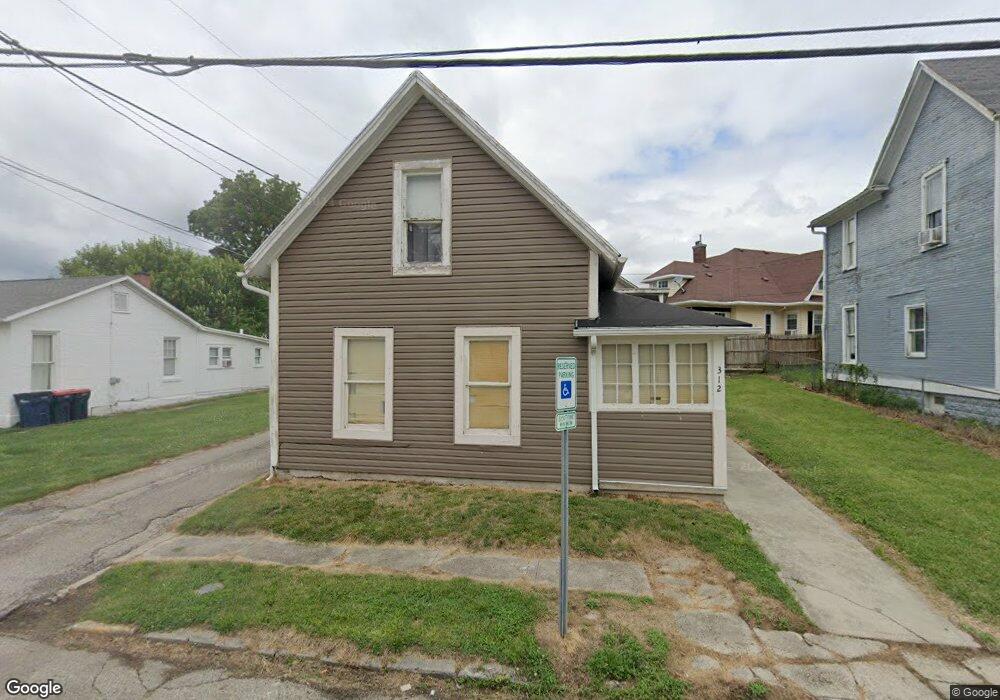
This home is located at 312 Camp St, Piqua, OH 45356 and is currently estimated at $105,253, approximately $128 per square foot. 312 Camp St is a home located in Miami County with nearby schools including Piqua Central Intermediate School, Springcreek Primary School, and Piqua Junior High School.
Ownership History
Date
Name
Owned For
Owner Type
Purchase Details
Closed on
Dec 8, 2003
Sold by
Fannie Mae
Bought by
Barga Steven R and Barga Heidi S
Current Estimated Value
Home Financials for this Owner
Home Financials are based on the most recent Mortgage that was taken out on this home.
Original Mortgage
$12,750
Outstanding Balance
$5,999
Interest Rate
6.1%
Mortgage Type
New Conventional
Estimated Equity
$99,254
Purchase Details
Closed on
Sep 4, 2003
Sold by
Cox Charles A
Bought by
Federal National Mortgage Association
Purchase Details
Closed on
Mar 12, 1996
Sold by
Supinger William L
Bought by
Penney Helen A
Purchase Details
Closed on
Jun 1, 1984
Bought by
Dills Irmtraud
Create a Home Valuation Report for This Property
The Home Valuation Report is an in-depth analysis detailing your home's value as well as a comparison with similar homes in the area
Home Values in the Area
Average Home Value in this Area
Purchase History
| Date | Buyer | Sale Price | Title Company |
|---|---|---|---|
| Barga Steven R | $15,000 | -- | |
| Federal National Mortgage Association | $26,000 | -- | |
| Penney Helen A | $44,500 | -- | |
| Dills Irmtraud | -- | -- |
Source: Public Records
Mortgage History
| Date | Status | Borrower | Loan Amount |
|---|---|---|---|
| Open | Federal National Mortgage Association | $12,750 |
Source: Public Records
Tax History Compared to Growth
Tax History
| Year | Tax Paid | Tax Assessment Tax Assessment Total Assessment is a certain percentage of the fair market value that is determined by local assessors to be the total taxable value of land and additions on the property. | Land | Improvement |
|---|---|---|---|---|
| 2024 | $866 | $19,290 | $6,370 | $12,920 |
| 2023 | $866 | $19,290 | $6,370 | $12,920 |
| 2022 | $854 | $19,290 | $6,370 | $12,920 |
| 2021 | $720 | $14,840 | $4,900 | $9,940 |
| 2020 | $709 | $14,840 | $4,900 | $9,940 |
| 2019 | $712 | $14,840 | $4,900 | $9,940 |
| 2018 | $635 | $12,500 | $5,110 | $7,390 |
| 2017 | $640 | $12,500 | $5,110 | $7,390 |
| 2016 | $634 | $12,500 | $5,110 | $7,390 |
| 2015 | $624 | $12,010 | $4,900 | $7,110 |
| 2014 | $624 | $12,010 | $4,900 | $7,110 |
| 2013 | $626 | $12,010 | $4,900 | $7,110 |
Source: Public Records
Map
Nearby Homes