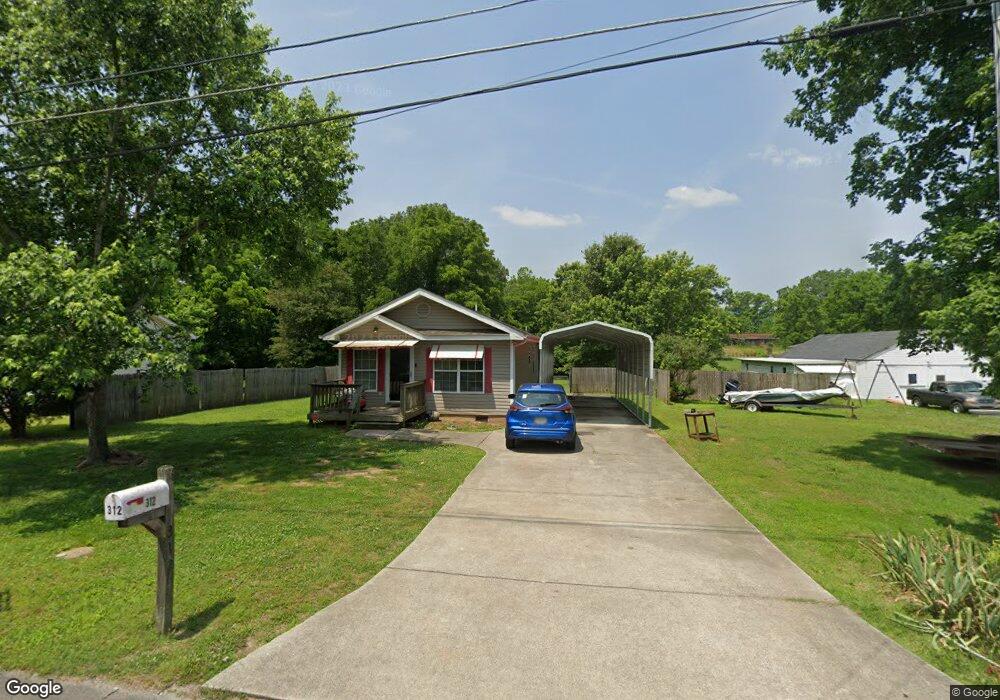
312 Central St Rossville, GA 30741
Estimated Value: $165,000 - $192,000
2
Beds
1
Bath
1,100
Sq Ft
$165/Sq Ft
Est. Value
About This Home
This home is located at 312 Central St, Rossville, GA 30741 and is currently estimated at $181,191, approximately $164 per square foot. 312 Central St is a home located in Walker County with nearby schools including Stone Creek Elementary School, Rossville Middle School, and Ridgeland High School.
Ownership History
Date
Name
Owned For
Owner Type
Purchase Details
Closed on
Aug 24, 2013
Sold by
Fuller Rufus
Bought by
Ramsey Carla F
Current Estimated Value
Purchase Details
Closed on
Dec 7, 2010
Sold by
Beatty James E
Bought by
Ramsey Carla F
Purchase Details
Closed on
Aug 15, 2008
Sold by
Beatty Carla F
Bought by
Fuller Rufus and Fuller Barbara
Purchase Details
Closed on
Feb 20, 2007
Sold by
Hicks Michael
Bought by
Beatty Carla F
Home Financials for this Owner
Home Financials are based on the most recent Mortgage that was taken out on this home.
Original Mortgage
$56,900
Interest Rate
5.93%
Mortgage Type
New Conventional
Purchase Details
Closed on
Nov 3, 2006
Sold by
Not Provided
Bought by
Ramsey Carla F
Purchase Details
Closed on
Aug 4, 1988
Sold by
Williams Allen R
Bought by
Byous Cynthia W
Purchase Details
Closed on
Jan 1, 1972
Bought by
Williams Allen R
Create a Home Valuation Report for This Property
The Home Valuation Report is an in-depth analysis detailing your home's value as well as a comparison with similar homes in the area
Home Values in the Area
Average Home Value in this Area
Purchase History
| Date | Buyer | Sale Price | Title Company |
|---|---|---|---|
| Ramsey Carla F | -- | -- | |
| Ramsey Carla F | -- | -- | |
| Fuller Rufus | -- | -- | |
| Beatty Carla F | $77,500 | -- | |
| Ramsey Carla F | $35,000 | -- | |
| Byous Cynthia W | -- | -- | |
| Williams Allen R | -- | -- |
Source: Public Records
Mortgage History
| Date | Status | Borrower | Loan Amount |
|---|---|---|---|
| Previous Owner | Beatty Carla F | $56,900 |
Source: Public Records
Tax History Compared to Growth
Tax History
| Year | Tax Paid | Tax Assessment Tax Assessment Total Assessment is a certain percentage of the fair market value that is determined by local assessors to be the total taxable value of land and additions on the property. | Land | Improvement |
|---|---|---|---|---|
| 2024 | $1,806 | $55,312 | $4,502 | $50,810 |
| 2023 | $1,735 | $52,567 | $4,502 | $48,065 |
| 2022 | $1,034 | $39,288 | $4,502 | $34,786 |
| 2021 | $750 | $25,533 | $4,502 | $21,031 |
| 2020 | $660 | $21,497 | $4,502 | $16,995 |
| 2019 | $660 | $21,497 | $4,502 | $16,995 |
| 2018 | $640 | $21,497 | $4,502 | $16,995 |
| 2017 | $715 | $21,497 | $4,502 | $16,995 |
| 2016 | $593 | $21,497 | $4,502 | $16,995 |
| 2015 | $683 | $23,608 | $4,452 | $19,156 |
| 2014 | $658 | $23,608 | $4,452 | $19,156 |
| 2013 | -- | $23,608 | $4,452 | $19,156 |
Source: Public Records
Map
Nearby Homes
- 126 S Liner St
- 4 Carroll Ln
- 105 Elm St
- 1014 Lee Ave
- 816 Indian Ave
- 1204 Wooden Ave
- 601 James St
- 610 Union Ave
- 916 Logan Ave
- 136 Summit St
- Lot 81 Battle Bluff Dr
- Lot 80 Battle Bluff Dr
- Lot 79 Battle Bluff Dr
- 200 W Oak St
- 405 Miami Ave
- 635 N Sherry Dr
- 328 S Mission Ridge Dr
- 806 Mcfarland Ave
- 715 W James St
- 164 S Mission Ridge Dr
- 314 Central St
- 310 Central St
- 0 Central St Unit 3269488
- 313 Central St Unit 315
- 200 W Wotring St
- 107 Ellis Dr
- 105 Ellis Dr
- 109 Ellis Dr
- 1410 Bethune St
- 308 Central St
- 103 Ellis Dr
- 106 Suggs St
- 106 Suggs St Unit 1
- 111 Ellis Dr
- 315 Central St
- 315 Central St Unit 2
- 104 Suggs St
- 108 Suggs St
- 110 Suggs St
- 1408 Bethune St