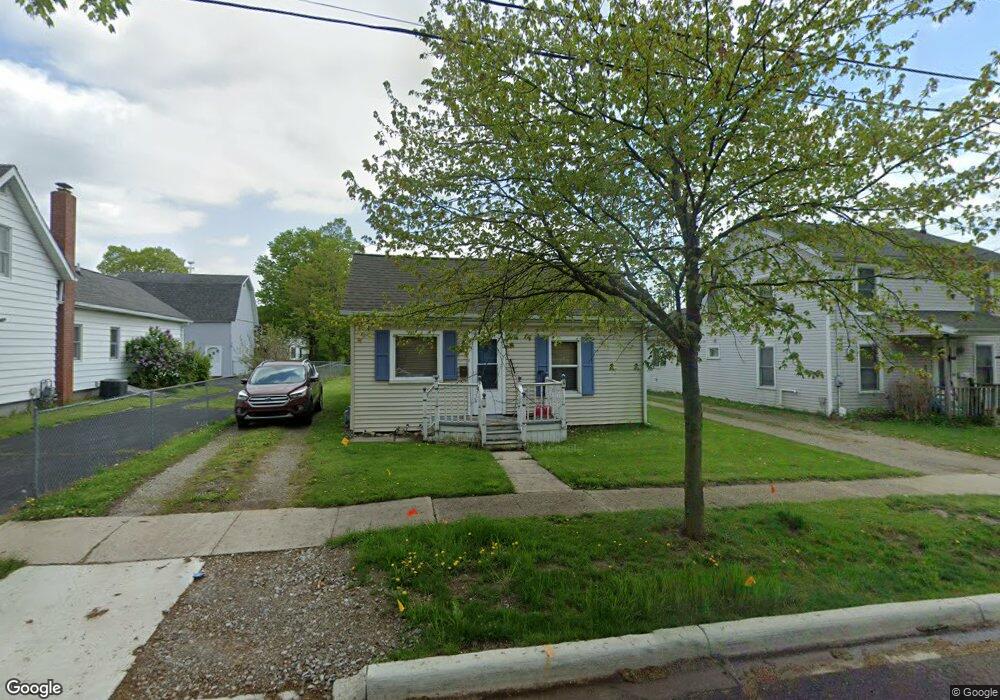
312 Cherry St Adrian, MI 49221
Estimated Value: $94,000 - $138,000
2
Beds
1
Bath
936
Sq Ft
$129/Sq Ft
Est. Value
About This Home
This home is located at 312 Cherry St, Adrian, MI 49221 and is currently estimated at $120,978, approximately $129 per square foot. 312 Cherry St is a home located in Lenawee County with nearby schools including Adrian High School, Berean Baptist Academy, and Trenton Hills Learning Center.
Ownership History
Date
Name
Owned For
Owner Type
Purchase Details
Closed on
Nov 10, 2011
Sold by
Tlc Community Credit Union
Bought by
Burch Olis B and Burch Lois L
Current Estimated Value
Purchase Details
Closed on
Jan 6, 2011
Sold by
Morgan Emily
Bought by
Tlc Community Credit Union
Purchase Details
Closed on
Nov 2, 2007
Sold by
Cole Patricia N
Bought by
Morgan Emily
Home Financials for this Owner
Home Financials are based on the most recent Mortgage that was taken out on this home.
Original Mortgage
$81,500
Interest Rate
6.45%
Mortgage Type
New Conventional
Create a Home Valuation Report for This Property
The Home Valuation Report is an in-depth analysis detailing your home's value as well as a comparison with similar homes in the area
Home Values in the Area
Average Home Value in this Area
Purchase History
| Date | Buyer | Sale Price | Title Company |
|---|---|---|---|
| Burch Olis B | $22,600 | None Available | |
| Tlc Community Credit Union | $83,492 | None Available | |
| Morgan Emily | $81,500 | First American Title Insuran |
Source: Public Records
Mortgage History
| Date | Status | Borrower | Loan Amount |
|---|---|---|---|
| Previous Owner | Morgan Emily | $81,500 |
Source: Public Records
Tax History
| Year | Tax Paid | Tax Assessment Tax Assessment Total Assessment is a certain percentage of the fair market value that is determined by local assessors to be the total taxable value of land and additions on the property. | Land | Improvement |
|---|---|---|---|---|
| 2025 | $2,142 | $44,300 | $0 | $0 |
| 2024 | $16 | $41,800 | $0 | $0 |
| 2023 | $2,044 | $39,000 | $0 | $0 |
| 2022 | $1,732 | $37,100 | $0 | $0 |
| 2021 | $1,701 | $34,400 | $0 | $0 |
| 2020 | $1,690 | $32,100 | $0 | $0 |
| 2019 | $77,115 | $30,700 | $0 | $0 |
| 2018 | $1,630 | $40,192 | $0 | $0 |
| 2017 | $1,584 | $31,105 | $0 | $0 |
| 2016 | $1,571 | $28,791 | $0 | $0 |
| 2014 | -- | $25,500 | $0 | $0 |
Source: Public Records
Map
Nearby Homes
- 306 Summer St
- 333 Greenly St
- 227 Greenly St
- 703 Company St
- 228 W Church St
- 143 Park St
- 559 Northwestern Dr
- 169 Park St
- 146 Budlong St
- 705 College Ave
- 371 Riverside Ave
- 453 Riverside Ave
- 914 W Maumee St
- 229 Clinton St
- 547 Riverside Ave
- 612 N Clinton St
- 313 Rice St
- 155 S Scott St
- 423 E Butler St
- 417 E Hunt St
Your Personal Tour Guide
Ask me questions while you tour the home.