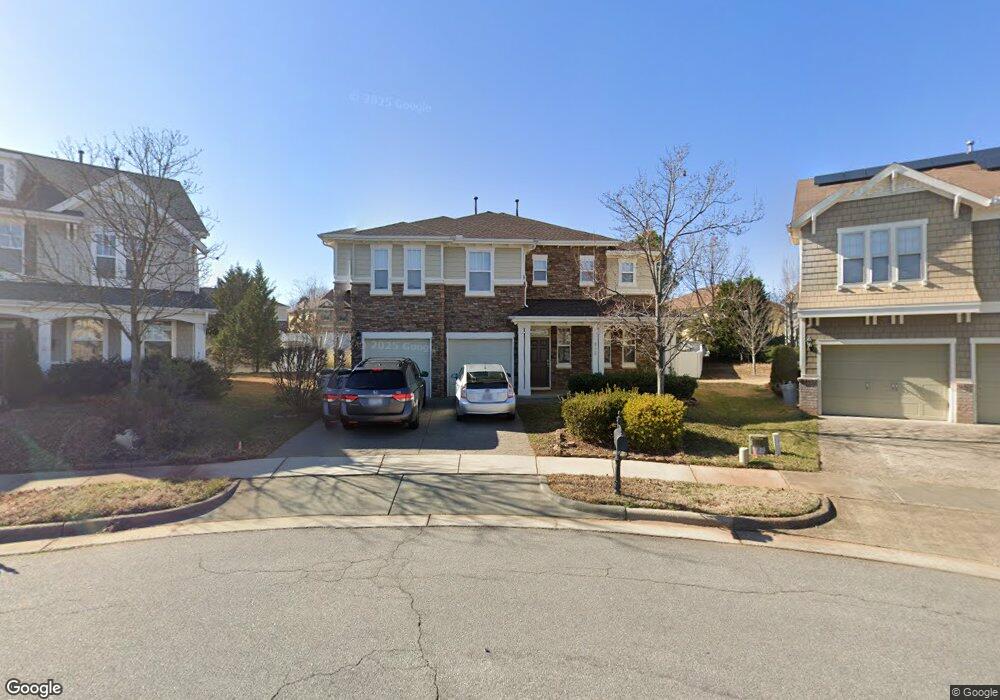
312 Down East Place Cary, NC 27519
Twin Lakes NeighborhoodEstimated Value: $720,000 - $738,000
--
Bed
3
Baths
3,053
Sq Ft
$240/Sq Ft
Est. Value
About This Home
This home is located at 312 Down East Place, Cary, NC 27519 and is currently estimated at $732,863, approximately $240 per square foot. 312 Down East Place is a home located in Wake County with nearby schools including Cedar Fork Elementary, West Cary Middle School, and Panther Creek High School.
Ownership History
Date
Name
Owned For
Owner Type
Purchase Details
Closed on
Dec 26, 2024
Sold by
Gu Tao and Shi Xixia
Bought by
Rose Benjamin and Rose Whitney
Current Estimated Value
Home Financials for this Owner
Home Financials are based on the most recent Mortgage that was taken out on this home.
Original Mortgage
$588,000
Outstanding Balance
$583,941
Interest Rate
6.84%
Mortgage Type
New Conventional
Estimated Equity
$148,923
Purchase Details
Closed on
Feb 19, 2008
Sold by
Kb Home Raleigh Durham Inc
Bought by
Gu Tao
Home Financials for this Owner
Home Financials are based on the most recent Mortgage that was taken out on this home.
Original Mortgage
$260,500
Interest Rate
5.85%
Mortgage Type
Purchase Money Mortgage
Create a Home Valuation Report for This Property
The Home Valuation Report is an in-depth analysis detailing your home's value as well as a comparison with similar homes in the area
Home Values in the Area
Average Home Value in this Area
Purchase History
| Date | Buyer | Sale Price | Title Company |
|---|---|---|---|
| Rose Benjamin | $735,000 | None Listed On Document | |
| Rose Benjamin | $735,000 | None Listed On Document | |
| Gu Tao | $326,000 | None Available |
Source: Public Records
Mortgage History
| Date | Status | Borrower | Loan Amount |
|---|---|---|---|
| Open | Rose Benjamin | $588,000 | |
| Closed | Rose Benjamin | $588,000 | |
| Previous Owner | Gu Tao | $260,500 |
Source: Public Records
Tax History Compared to Growth
Tax History
| Year | Tax Paid | Tax Assessment Tax Assessment Total Assessment is a certain percentage of the fair market value that is determined by local assessors to be the total taxable value of land and additions on the property. | Land | Improvement |
|---|---|---|---|---|
| 2025 | $5,548 | $645,019 | $180,000 | $465,019 |
| 2024 | $5,428 | $645,019 | $180,000 | $465,019 |
| 2023 | $4,300 | $427,153 | $90,000 | $337,153 |
| 2022 | $4,140 | $427,153 | $90,000 | $337,153 |
| 2021 | $4,057 | $427,153 | $90,000 | $337,153 |
| 2020 | $4,078 | $427,153 | $90,000 | $337,153 |
| 2019 | $3,809 | $353,904 | $78,000 | $275,904 |
| 2018 | $3,575 | $353,904 | $78,000 | $275,904 |
| 2017 | $3,435 | $353,904 | $78,000 | $275,904 |
| 2016 | $3,384 | $353,904 | $78,000 | $275,904 |
| 2015 | $3,342 | $337,415 | $60,000 | $277,415 |
| 2014 | $3,151 | $337,415 | $60,000 | $277,415 |
Source: Public Records
Map
Nearby Homes
- 712 Pierside Dr
- 716 Pierside Dr
- 501 Tranquil Sound Dr
- 214 Trolley Car Way
- 605 Beech Hanger Dr
- 207 Hampshire Downs Dr
- 234 Hampshire Downs Dr
- 106 Honeycomb Ln
- 2010 Rapid Falls Rd
- 1329 Alemany St
- 1313 Alemany St
- 226 Leacroft Way
- 116 Plank Bridge Way
- 417 Downing Glen Dr
- 1001 Kelnor Ct
- 3141 Rapid Falls Rd
- 3147 Rapid Falls Rd
- 309 Malvern Hill Ln
- 111 Governors House Dr
- 200 Indian Branch Dr
- 308 Down East Place
- 308 Down Place E
- 316 Down East Place
- 316 Down Place E
- 204 Lime Creek Ct
- 6004 Lake Grove Blvd
- 304 Down East Place
- 6006 Lake Grove Blvd
- 206 Lime Creek Ct
- 202 Lime Creek Ct
- 6008 Lake Grove Blvd
- 208 Lime Creek Ct
- 317 Down East Place
- 6010 Lake Grove Blvd
- 300 Down East Place
- 313 Down Place E
- 309 Down Place E
- 313 Down East Place
- 6012 Lake Grove Blvd
- 201 Lime Creek Ct