Estimated Value: $175,000 - $327,000
2
Beds
3
Baths
979
Sq Ft
$234/Sq Ft
Est. Value
About This Home
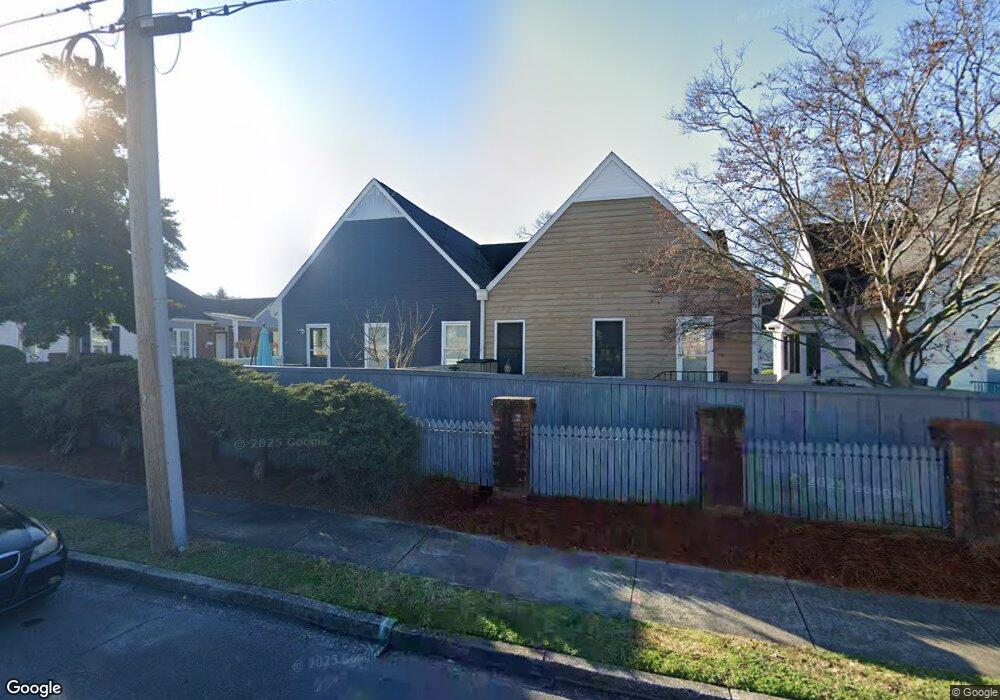
This home is located at 312 E 7th St SW Unit 18, Rome, GA 30161 and is currently estimated at $229,395, approximately $234 per square foot. 312 E 7th St SW Unit 18 is a home located in Floyd County with nearby schools including Rome High School, St. Mary School, and Darlington School.
Ownership History
Date
Name
Owned For
Owner Type
Purchase Details
Closed on
Mar 5, 2020
Sold by
Chip Properties Llc
Bought by
Riddle Maureen B
Current Estimated Value
Purchase Details
Closed on
Oct 10, 2016
Sold by
Garrett Patrick C and Garrett Susie H
Bought by
Chip Properties Llc
Purchase Details
Closed on
Mar 2, 2010
Sold by
Kondo Hiroyuki
Bought by
Garrett Patrick C
Home Financials for this Owner
Home Financials are based on the most recent Mortgage that was taken out on this home.
Original Mortgage
$66,160
Interest Rate
5.01%
Mortgage Type
Purchase Money Mortgage
Purchase Details
Closed on
Jun 6, 1997
Sold by
Betz Charles J
Bought by
Kondo Hiroyuki
Purchase Details
Closed on
Oct 2, 1992
Bought by
P and R
Purchase Details
Closed on
Sep 30, 1992
Bought by
P and R
Purchase Details
Closed on
Mar 18, 1992
Sold by
Busbin John C
Bought by
Betz Charles J
Purchase Details
Closed on
Dec 23, 1985
Bought by
Busbin John C
Create a Home Valuation Report for This Property
The Home Valuation Report is an in-depth analysis detailing your home's value as well as a comparison with similar homes in the area
Home Values in the Area
Average Home Value in this Area
Purchase History
| Date | Buyer | Sale Price | Title Company |
|---|---|---|---|
| Riddle Maureen B | -- | -- | |
| Chip Properties Llc | $90,000 | -- | |
| Garrett Patrick C | $82,700 | -- | |
| Kondo Hiroyuki | $73,000 | -- | |
| P | -- | -- | |
| P | -- | -- | |
| Betz Charles J | $66,500 | -- | |
| Busbin John C | $54,900 | -- |
Source: Public Records
Mortgage History
| Date | Status | Borrower | Loan Amount |
|---|---|---|---|
| Previous Owner | Garrett Patrick C | $66,160 |
Source: Public Records
Tax History
| Year | Tax Paid | Tax Assessment Tax Assessment Total Assessment is a certain percentage of the fair market value that is determined by local assessors to be the total taxable value of land and additions on the property. | Land | Improvement |
|---|---|---|---|---|
| 2025 | $2,526 | $70,661 | $11,300 | $59,361 |
| 2024 | $2,526 | $65,955 | $10,273 | $55,682 |
| 2023 | $2,336 | $59,053 | $9,228 | $49,825 |
| 2022 | $1,804 | $49,449 | $7,636 | $41,813 |
| 2021 | $1,673 | $45,082 | $7,089 | $37,993 |
| 2020 | $1,745 | $46,639 | $5,453 | $41,186 |
| 2019 | $1,554 | $41,973 | $5,453 | $36,520 |
| 2018 | $1,481 | $40,023 | $5,453 | $34,570 |
| 2017 | $1,333 | $37,948 | $5,184 | $32,764 |
| 2016 | $1,303 | $35,081 | $5,440 | $29,641 |
| 2015 | $1,230 | $35,081 | $5,440 | $29,641 |
| 2014 | $1,230 | $35,081 | $5,440 | $29,641 |
Source: Public Records
Map
Nearby Homes
- 209 Moultrie Ln SE
- 801 Maple Ave SW
- 9 Eastridge Ct SW
- 416 E 9th St SE
- 415 E 10th St SE
- 2 Coral Ave SW
- 311 Roswell Ave SE
- 31 Notasulga Dr SW
- 307 E 11th St SE
- 803/805 Maple Ave SW
- 803/80 Maple Ave SW
- 162 E 11th St SE
- 170 E 11th St SW
- 166 E 11th St SW
- 1 E 11th St SW
- 168 E 11th St SE
- 164 E 11th St SE
- 811 Collinwood Rd SE
- 419 E 13th St SW
- 1011 Walnut Ave SW
- 312 E 7th St SW Unit 15
- 312 E 7th St SW Unit 12
- 312 E 7th St SW Unit 13
- 312 E 7th St SW Unit 14
- 312 E 7th St SW Unit 16
- 312 E 7th St SW Unit 17
- 312 E 7th St SW Unit 19
- 312 E 7th St SW Unit 11
- 312 E 7th St SW Unit 10
- 312 E 7th St SW Unit 9
- 312 E 7th St SW Unit 8
- 312 E 7th St SW Unit 7
- 312 E 7th St SW Unit 6
- 312 E 7th St SW Unit 5
- 312 E 7th St SW Unit 4
- 312 E 7th St SW Unit 3
- 312 E 7th St SW Unit 2
- 312 E 7th St SW Unit 2
- 312 E 7th St SW
- 312 E 7th St SW
Your Personal Tour Guide
Ask me questions while you tour the home.