Estimated Value: $168,000 - $203,000
Studio
2
Baths
945
Sq Ft
$195/Sq Ft
Est. Value
About This Home
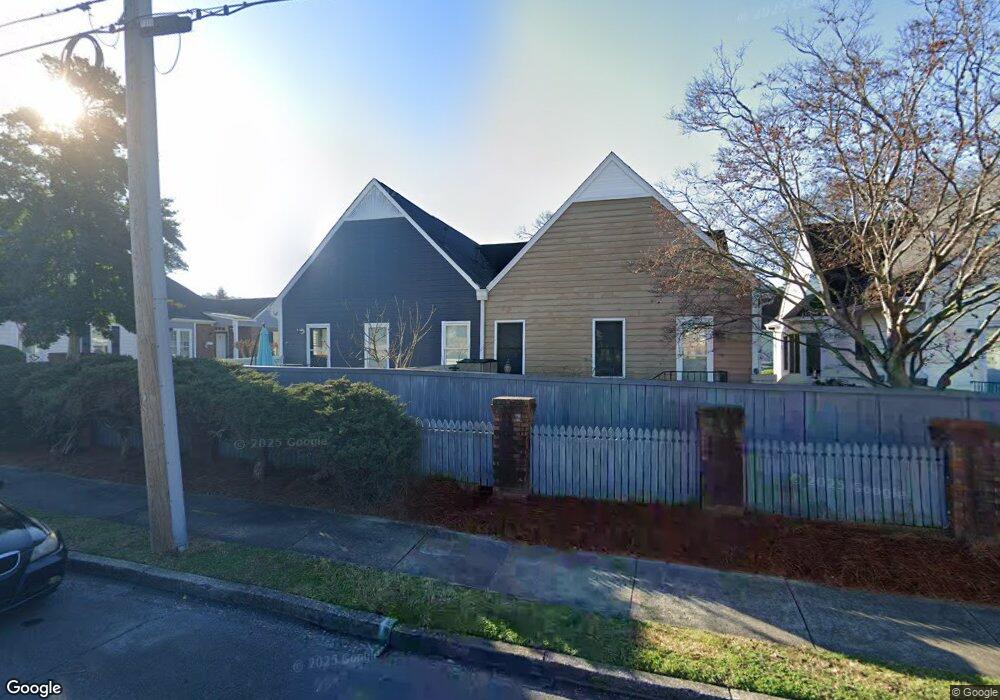
This home is located at 312 E 7th St SW Unit 2, Rome, GA 30161 and is currently estimated at $184,661, approximately $195 per square foot. 312 E 7th St SW Unit 2 is a home located in Floyd County with nearby schools including Rome High School, St. Mary School, and Darlington School.
Ownership History
Date
Name
Owned For
Owner Type
Purchase Details
Closed on
Sep 16, 2022
Sold by
Winterboer Janice
Bought by
Blue Ridge Miracle Llc
Current Estimated Value
Purchase Details
Closed on
Jun 6, 2016
Sold by
Ringstaff Marilyn
Bought by
Winterboer Janice
Purchase Details
Closed on
May 22, 2008
Sold by
Not Provided
Bought by
Ringstaff Marilyn
Purchase Details
Closed on
Oct 13, 2000
Sold by
Brown Julie S
Bought by
Johnston Leslie Jean
Purchase Details
Closed on
Nov 29, 1996
Sold by
Williamson Robert L
Bought by
Brown Julie S
Purchase Details
Closed on
Dec 14, 1995
Sold by
Orr Blanche T
Bought by
Williamson Robert L
Purchase Details
Closed on
May 28, 1993
Sold by
Conger Polly Ann
Bought by
Orr Blanche T
Purchase Details
Closed on
Apr 28, 1989
Sold by
Chester Calvin Bradley and Chester Tracy Q
Bought by
Conger Polly Ann
Purchase Details
Closed on
Sep 4, 1987
Bought by
Bradley Chester Calvin and Chester Tracy Q
Create a Home Valuation Report for This Property
The Home Valuation Report is an in-depth analysis detailing your home's value as well as a comparison with similar homes in the area
Home Values in the Area
Average Home Value in this Area
Purchase History
| Date | Buyer | Sale Price | Title Company |
|---|---|---|---|
| Blue Ridge Miracle Llc | $129,500 | -- | |
| Winterboer Janice | $87,500 | -- | |
| Ringstaff Marilyn | $110,000 | -- | |
| Ringstaff Marilyn | $110,000 | -- | |
| Johnston Leslie Jean | $89,000 | -- | |
| Brown Julie S | $75,500 | -- | |
| Williamson Robert L | $72,000 | -- | |
| Orr Blanche T | $65,000 | -- | |
| Conger Polly Ann | $69,000 | -- | |
| Bradley Chester Calvin | $58,500 | -- | |
| P | -- | -- |
Source: Public Records
Tax History Compared to Growth
Tax History
| Year | Tax Paid | Tax Assessment Tax Assessment Total Assessment is a certain percentage of the fair market value that is determined by local assessors to be the total taxable value of land and additions on the property. | Land | Improvement |
|---|---|---|---|---|
| 2025 | $2,550 | $71,329 | $12,756 | $58,573 |
| 2024 | $2,550 | $66,466 | $11,596 | $54,870 |
| 2023 | $2,354 | $59,476 | $10,423 | $49,053 |
| 2022 | $1,813 | $49,680 | $8,629 | $41,051 |
| 2021 | $1,680 | $45,266 | $8,081 | $37,185 |
| 2020 | $1,590 | $42,482 | $6,216 | $36,266 |
| 2019 | $1,420 | $38,360 | $6,216 | $32,144 |
| 2018 | $1,356 | $36,632 | $6,216 | $30,416 |
| 2017 | $1,283 | $34,655 | $5,947 | $28,708 |
| 2016 | $1,121 | $31,480 | $6,200 | $25,280 |
| 2015 | $1,168 | $31,840 | $6,200 | $25,640 |
| 2014 | $1,168 | $34,560 | $6,200 | $28,360 |
Source: Public Records
Map
Nearby Homes
- 801 Maple Ave SW
- 9 Eastridge Ct SW
- 415 E 10th St SE
- 2 Fair St SW
- 2 Coral Ave SW
- 311 Roswell Ave SE
- 31 Notasulga Dr SW
- 307 E 11th St SE
- 803/805 Maple Ave SW
- 162 E 11th St SE
- 170 E 11th St SW
- 166 E 11th St SW
- 168 E 11th St SE
- 164 E 11th St SE
- 2 E 10th St SW
- 1011 Walnut Ave SW
- 1 Vassar Dr SE
- 320 E 3rd Ave
- 0 Turnbull Dr SE Unit 10570009
- 525 E 14th St SW
- 312 E 7th St SW Unit 15
- 312 E 7th St SW Unit 12
- 312 E 7th St SW Unit 13
- 312 E 7th St SW Unit 14
- 312 E 7th St SW Unit 16
- 312 E 7th St SW Unit 17
- 312 E 7th St SW Unit 18
- 312 E 7th St SW Unit 19
- 312 E 7th St SW Unit 11
- 312 E 7th St SW Unit 10
- 312 E 7th St SW Unit 9
- 312 E 7th St SW Unit 8
- 312 E 7th St SW Unit 7
- 312 E 7th St SW Unit 6
- 312 E 7th St SW Unit 5
- 312 E 7th St SW Unit 4
- 312 E 7th St SW Unit 3
- 312 E 7th St SW Unit 2
- 312 E 7th St SW
- 312 E 7th St SW