Estimated Value: $227,018 - $302,000
--
Bed
2
Baths
2,000
Sq Ft
$135/Sq Ft
Est. Value
About This Home
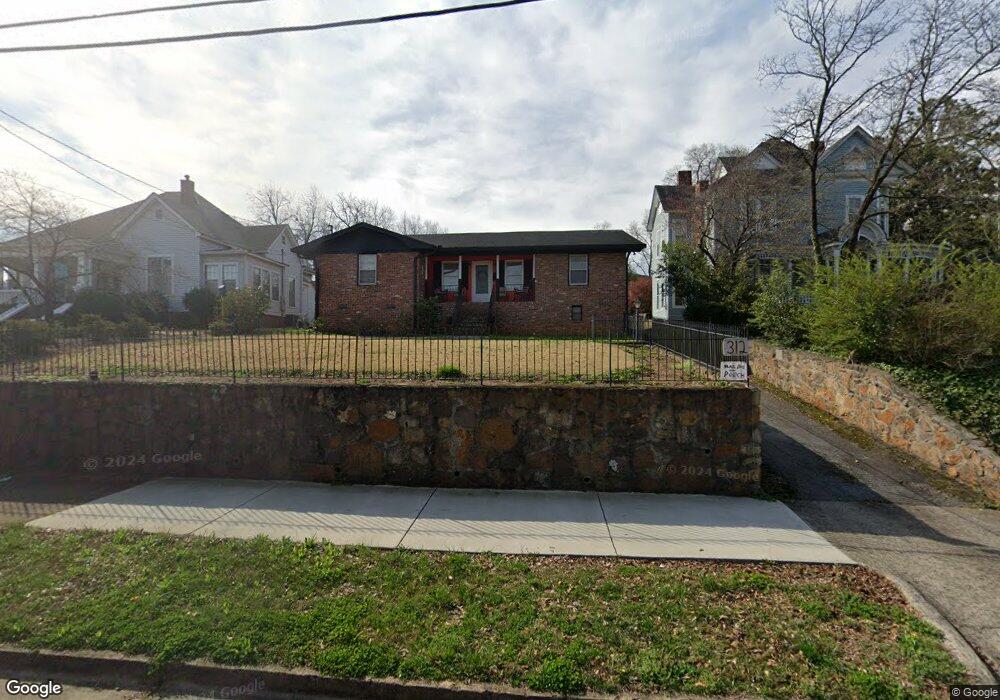
This home is located at 312 E 8th St SW, Rome, GA 30161 and is currently estimated at $269,505, approximately $134 per square foot. 312 E 8th St SW is a home located in Floyd County with nearby schools including Dan McCarty Middle School, Rome High School, and St. Mary School.
Ownership History
Date
Name
Owned For
Owner Type
Purchase Details
Closed on
Sep 27, 2011
Sold by
Andrews Robert L
Bought by
Andrews Jessie J
Current Estimated Value
Purchase Details
Closed on
Aug 14, 1989
Sold by
Fowler Doris C
Bought by
Andrews Robert L and Andrews Jessie J
Purchase Details
Closed on
Jun 8, 1981
Sold by
Carter Carter L and Carter Alma L
Bought by
Fowler Doris C
Purchase Details
Closed on
Dec 30, 1977
Sold by
West Larry J and West Glenda H
Bought by
Carter Carter L and Carter Alma L
Purchase Details
Closed on
Sep 29, 1970
Sold by
Norment Frank and Norment Jean
Bought by
West Larry J and West Glenda H
Purchase Details
Closed on
Aug 15, 1966
Sold by
Mann Int Ethel Toles Smith
Bought by
Norment Frank and Norment Jean
Purchase Details
Closed on
Jan 27, 1957
Sold by
Mann Robert Mrs Int To Faye
Bought by
Mann Int Ethel Toles Smith
Purchase Details
Closed on
Jan 26, 1957
Bought by
Mann Robert Mrs Int To Faye
Create a Home Valuation Report for This Property
The Home Valuation Report is an in-depth analysis detailing your home's value as well as a comparison with similar homes in the area
Home Values in the Area
Average Home Value in this Area
Purchase History
| Date | Buyer | Sale Price | Title Company |
|---|---|---|---|
| Andrews Jessie J | -- | -- | |
| Andrews Robert L | $60,000 | -- | |
| Fowler Doris C | $59,000 | -- | |
| Carter Carter L | $35,000 | -- | |
| West Larry J | -- | -- | |
| Norment Frank | $23,000 | -- | |
| Mann Int Ethel Toles Smith | -- | -- | |
| Mann Robert Mrs Int To Faye | -- | -- |
Source: Public Records
Tax History Compared to Growth
Tax History
| Year | Tax Paid | Tax Assessment Tax Assessment Total Assessment is a certain percentage of the fair market value that is determined by local assessors to be the total taxable value of land and additions on the property. | Land | Improvement |
|---|---|---|---|---|
| 2024 | $1,432 | $86,162 | $8,923 | $77,239 |
| 2023 | $1,198 | $73,477 | $8,112 | $65,365 |
| 2022 | $1,031 | $61,088 | $6,692 | $54,396 |
| 2021 | $951 | $55,558 | $6,692 | $48,866 |
| 2020 | $885 | $51,178 | $5,070 | $46,108 |
| 2019 | $825 | $48,419 | $5,070 | $43,349 |
| 2018 | $777 | $45,684 | $5,070 | $40,614 |
| 2017 | $737 | $43,402 | $5,070 | $38,332 |
| 2016 | $711 | $41,664 | $5,040 | $36,624 |
| 2015 | $633 | $41,664 | $5,040 | $36,624 |
| 2014 | $633 | $41,664 | $5,040 | $36,624 |
Source: Public Records
Map
Nearby Homes
- 9 Eastridge Ct SW
- 801 Maple Ave SW
- 211 E 11th St SE
- 31 Notasulga Dr SW
- 2 Fair St SW
- 2 Coral Ave SW
- 702 River Ave SW
- 162 E 11th St SE
- 170 E 11th St SW
- 166 E 11th St SW
- 168 E 11th St SE
- 164 E 11th St SE
- 2 E 10th St SW
- 311 Roswell Ave SE
- 1 Vassar Dr SE
- 0 Turnbull Dr SE Unit 10570009
- 1314 E 2nd Ave SE
- 13 Townview Rd SE
- 206 E 4th St
- 310 E 8th St SW
- 310 E 8th St SW
- 314 E 8th St SW
- 209 Moultrie Ln SE
- 306 E 8th St SW
- 306 E 8th St SW
- 317 E 8th St SW
- 304 E 8th St SW Unit A
- 304 E 8th St SW
- 313 E 8th St SW
- 203 Moultrie Ln SE
- 305 SW E 8th St
- 305 E 8th St SW
- 303 E 8th St SW
- 302 E 8th St SW
- 315 E 8th St SW
- 201 Moultrie Ln SE
- 719 Lee Ave SW
- 715 Lee Ave SW
- 206 E 8th St SW