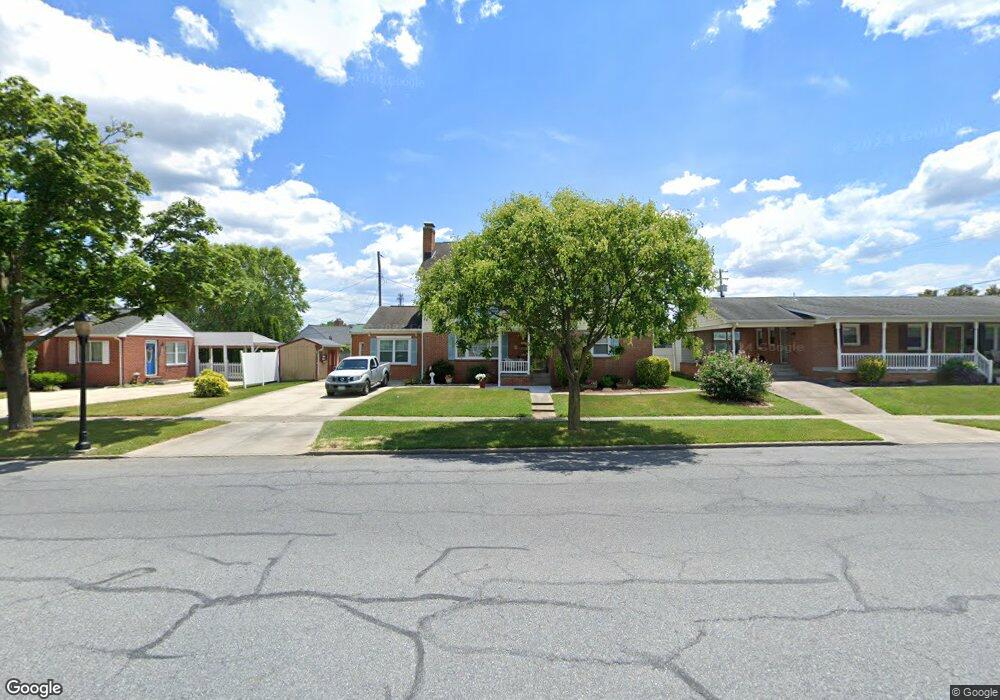
312 E 9th St Frederick, MD 21701
Monocacy Village NeighborhoodEstimated Value: $468,566 - $611,000
Studio
3
Baths
2,828
Sq Ft
$181/Sq Ft
Est. Value
About This Home
This home is located at 312 E 9th St, Frederick, MD 21701 and is currently estimated at $511,142, approximately $180 per square foot. 312 E 9th St is a home located in Frederick County with nearby schools including North Frederick Elementary School, Gov. Thomas Johnson Middle School, and Gov. Thomas Johnson High School.
Ownership History
Date
Name
Owned For
Owner Type
Purchase Details
Closed on
May 15, 2017
Sold by
Bartgis Jenny R and Fogle Carolyn L
Bought by
Bartgis Jenny R and Bartgis Carolyn L
Current Estimated Value
Purchase Details
Closed on
Nov 18, 2008
Sold by
Fogle Carolyn L and Fogle Jenny R
Bought by
Bartgis Jenny R and Fogle Carolyn L
Purchase Details
Closed on
Oct 9, 2008
Sold by
Fogle Carolyn L and Fogle Jenny R
Bought by
Bartgis Jenny R and Fogle Carolyn L
Purchase Details
Closed on
Feb 12, 1991
Sold by
Fox Edward and Fox Hilda
Bought by
Fogle Carolyn L and Fogle Jenny R
Home Financials for this Owner
Home Financials are based on the most recent Mortgage that was taken out on this home.
Original Mortgage
$105,000
Interest Rate
9.36%
Purchase Details
Closed on
Nov 2, 1984
Sold by
Hobgood Chas B and Hobgood Emily C
Bought by
Fox Edward and Fox Hilda
Create a Home Valuation Report for This Property
The Home Valuation Report is an in-depth analysis detailing your home's value as well as a comparison with similar homes in the area
Home Values in the Area
Average Home Value in this Area
Purchase History
| Date | Buyer | Sale Price | Title Company |
|---|---|---|---|
| Bartgis Jenny R | -- | None Available | |
| Bartgis Jenny R | -- | -- | |
| Bartgis Jenny R | -- | -- | |
| Fogle Carolyn L | $125,000 | -- | |
| Fox Edward | $78,000 | -- |
Source: Public Records
Mortgage History
| Date | Status | Borrower | Loan Amount |
|---|---|---|---|
| Previous Owner | Fogle Carolyn L | $105,000 |
Source: Public Records
Tax History
| Year | Tax Paid | Tax Assessment Tax Assessment Total Assessment is a certain percentage of the fair market value that is determined by local assessors to be the total taxable value of land and additions on the property. | Land | Improvement |
|---|---|---|---|---|
| 2025 | $7,450 | $449,300 | $102,000 | $347,300 |
| 2024 | $7,450 | $420,600 | $0 | $0 |
| 2023 | $2,846 | $391,900 | $0 | $0 |
| 2022 | $6,533 | $363,200 | $91,300 | $271,900 |
| 2021 | $7,403 | $350,867 | $0 | $0 |
| 2020 | $3,674 | $338,533 | $0 | $0 |
| 2019 | $2,081 | $326,200 | $85,000 | $241,200 |
| 2018 | $1,988 | $320,600 | $0 | $0 |
| 2017 | $5,650 | $326,200 | $0 | $0 |
| 2016 | $5,987 | $302,400 | $0 | $0 |
| 2015 | $5,987 | $299,433 | $0 | $0 |
| 2014 | $5,987 | $296,467 | $0 | $0 |
Source: Public Records
Map
Nearby Homes
Your Personal Tour Guide
Ask me questions while you tour the home.