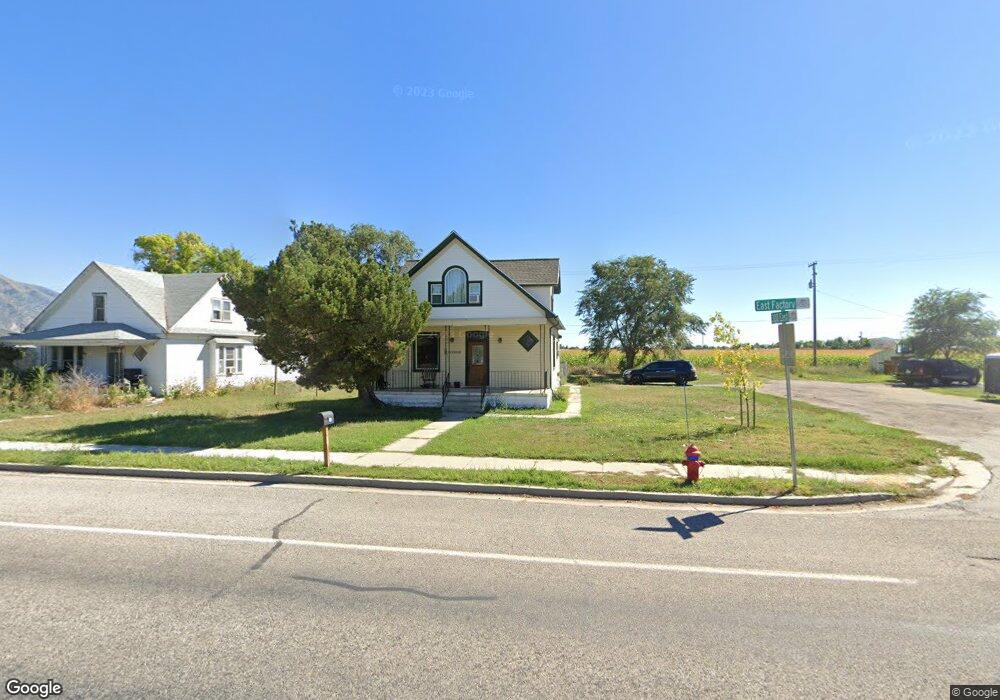
312 E Factory St Garland, UT 84312
Estimated Value: $297,000 - $321,124
3
Beds
2
Baths
1,460
Sq Ft
$212/Sq Ft
Est. Value
About This Home
This home is located at 312 E Factory St, Garland, UT 84312 and is currently estimated at $310,031, approximately $212 per square foot. 312 E Factory St is a home located in Box Elder County with nearby schools including Garland School, Bear River Middle School, and Alice C. Harris Intermediate School.
Ownership History
Date
Name
Owned For
Owner Type
Purchase Details
Closed on
Jun 7, 2023
Sold by
Douthit Cliff
Bought by
Tanner Hermann and Ryles Hermann Morgan
Current Estimated Value
Home Financials for this Owner
Home Financials are based on the most recent Mortgage that was taken out on this home.
Original Mortgage
$12,645
Outstanding Balance
$12,309
Interest Rate
6.43%
Estimated Equity
$297,722
Purchase Details
Closed on
Feb 13, 2019
Sold by
Celaya Michael Anthony
Bought by
Douthit Cliff
Purchase Details
Closed on
Apr 29, 2010
Sold by
Mendoza Maria Cecilia and Betancourt Cecilia
Bought by
Celaya Michael Anthony
Home Financials for this Owner
Home Financials are based on the most recent Mortgage that was taken out on this home.
Original Mortgage
$85,069
Interest Rate
5.5%
Mortgage Type
FHA
Create a Home Valuation Report for This Property
The Home Valuation Report is an in-depth analysis detailing your home's value as well as a comparison with similar homes in the area
Home Values in the Area
Average Home Value in this Area
Purchase History
| Date | Buyer | Sale Price | Title Company |
|---|---|---|---|
| Tanner Hermann | -- | Cache Title | |
| Douthit Cliff | -- | Advanced Title | |
| Celaya Michael Anthony | -- | -- |
Source: Public Records
Mortgage History
| Date | Status | Borrower | Loan Amount |
|---|---|---|---|
| Open | Tanner Hermann | $12,645 | |
| Open | Tanner Hermann | $309,294 | |
| Previous Owner | Celaya Michael Anthony | $85,069 |
Source: Public Records
Tax History
| Year | Tax Paid | Tax Assessment Tax Assessment Total Assessment is a certain percentage of the fair market value that is determined by local assessors to be the total taxable value of land and additions on the property. | Land | Improvement |
|---|---|---|---|---|
| 2025 | $1,635 | $249,336 | $105,000 | $144,336 |
| 2024 | $1,409 | $241,873 | $100,000 | $141,873 |
| 2023 | $1,315 | $222,636 | $90,000 | $132,636 |
| 2022 | $1,129 | $179,326 | $25,000 | $154,326 |
| 2021 | $924 | $111,999 | $25,000 | $86,999 |
| 2020 | $806 | $111,999 | $25,000 | $86,999 |
| 2019 | $761 | $56,095 | $13,750 | $42,345 |
| 2018 | $567 | $39,048 | $13,750 | $25,298 |
| 2017 | $588 | $70,997 | $13,750 | $45,997 |
| 2016 | $561 | $37,844 | $13,750 | $24,094 |
| 2015 | $536 | $35,653 | $13,750 | $21,903 |
| 2014 | $536 | $34,610 | $13,750 | $20,860 |
| 2013 | -- | $34,611 | $13,338 | $21,273 |
Source: Public Records
Map
Nearby Homes
- 336 E Factory Rd
- 336 E Factory St
- 360 E Factory St
- 311 E Factory St
- 337 E Factory St
- 286 E Factory St
- 287 E Factory St
- 371 E Factory St
- 262 E Factory St
- 1400 S 400 E
- 1383 S 400 E Unit 7
- 49 N 400 E
- 360 E 100 N
- 410 E Factory St
- 325 E 100 N
- 47 N 300 E
- 237 E Factory St
- 87 N 400 E
- 411 E Factory St
- 264 E 100 N Unit 4
Your Personal Tour Guide
Ask me questions while you tour the home.