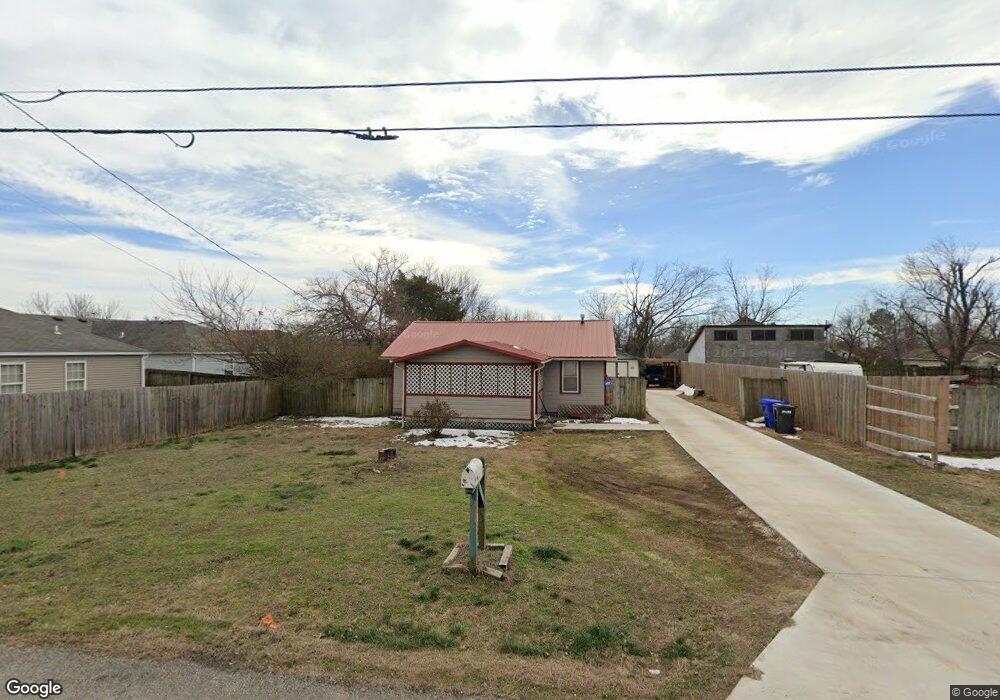
312 E Pinion St Rogers, AR 72756
Estimated Value: $286,142 - $324,000
3
Beds
2
Baths
1,600
Sq Ft
$190/Sq Ft
Est. Value
About This Home
This home is located at 312 E Pinion St, Rogers, AR 72756 and is currently estimated at $304,536, approximately $190 per square foot. 312 E Pinion St is a home located in Benton County with nearby schools including Frank Tillery Elementary School, Lingle Middle School, and Rogers Heritage High School.
Ownership History
Date
Name
Owned For
Owner Type
Purchase Details
Closed on
Mar 28, 2008
Sold by
Hunter Roy David and Hunter Nancy
Bought by
Alfaro Roberto and Alfaro Veronica Villegas
Current Estimated Value
Home Financials for this Owner
Home Financials are based on the most recent Mortgage that was taken out on this home.
Original Mortgage
$104,500
Outstanding Balance
$66,363
Interest Rate
6.19%
Mortgage Type
Purchase Money Mortgage
Estimated Equity
$238,173
Purchase Details
Closed on
Jul 26, 1985
Bought by
Hunter
Purchase Details
Closed on
Apr 9, 1977
Bought by
Sowder
Create a Home Valuation Report for This Property
The Home Valuation Report is an in-depth analysis detailing your home's value as well as a comparison with similar homes in the area
Home Values in the Area
Average Home Value in this Area
Purchase History
| Date | Buyer | Sale Price | Title Company |
|---|---|---|---|
| Alfaro Roberto | $110,000 | Lenders Title Company | |
| Hunter | $35,000 | -- | |
| Sowder | $15,000 | -- |
Source: Public Records
Mortgage History
| Date | Status | Borrower | Loan Amount |
|---|---|---|---|
| Open | Alfaro Roberto | $104,500 |
Source: Public Records
Tax History
| Year | Tax Paid | Tax Assessment Tax Assessment Total Assessment is a certain percentage of the fair market value that is determined by local assessors to be the total taxable value of land and additions on the property. | Land | Improvement |
|---|---|---|---|---|
| 2025 | $1,350 | $48,555 | $19,000 | $29,555 |
| 2024 | $1,257 | $48,555 | $19,000 | $29,555 |
| 2023 | $1,197 | $30,840 | $8,000 | $22,840 |
| 2022 | $816 | $30,840 | $8,000 | $22,840 |
| 2021 | $759 | $30,840 | $8,000 | $22,840 |
| 2020 | $706 | $20,170 | $3,200 | $16,970 |
| 2019 | $664 | $20,170 | $3,200 | $16,970 |
| 2018 | $646 | $20,170 | $3,200 | $16,970 |
| 2017 | $512 | $20,170 | $3,200 | $16,970 |
| 2016 | $512 | $20,170 | $3,200 | $16,970 |
| 2015 | $811 | $15,340 | $4,950 | $10,390 |
| 2014 | $461 | $15,340 | $4,950 | $10,390 |
Source: Public Records
Map
Nearby Homes
Your Personal Tour Guide
Ask me questions while you tour the home.