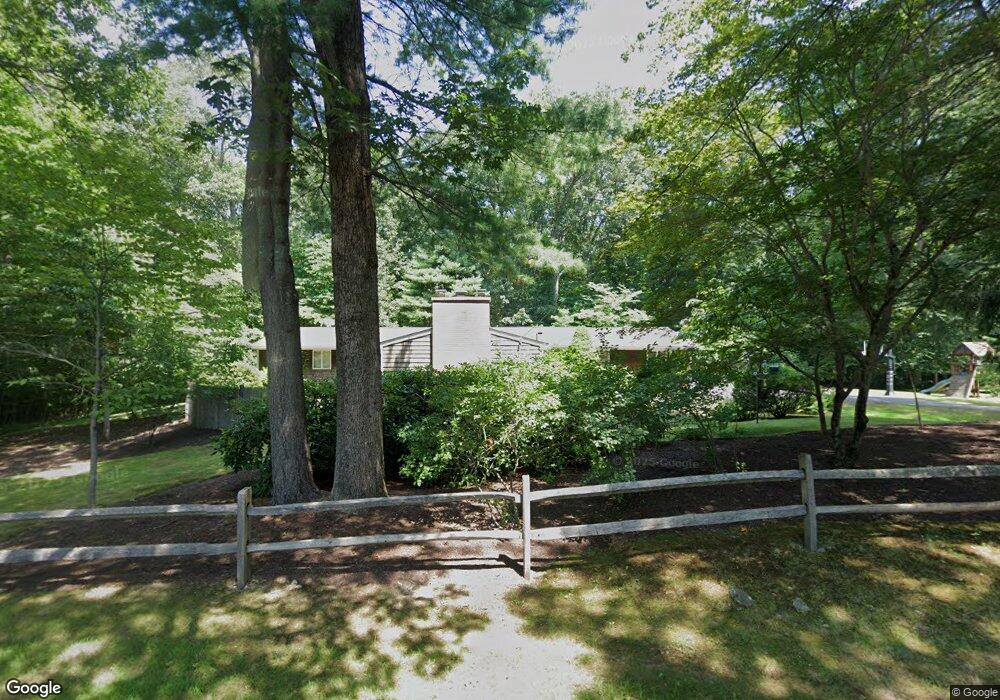
312 East St Attleboro, MA 02703
Estimated Value: $575,000 - $647,000
4
Beds
2
Baths
2,036
Sq Ft
$300/Sq Ft
Est. Value
About This Home
This home is located at 312 East St, Attleboro, MA 02703 and is currently estimated at $610,425, approximately $299 per square foot. 312 East St is a home located in Bristol County with nearby schools including Hyman Fine Elementary School, Wamsutta Middle School, and Attleboro High School.
Ownership History
Date
Name
Owned For
Owner Type
Purchase Details
Closed on
Sep 29, 2017
Sold by
Behler Deborah and Buckley Susan
Bought by
Stmartin Andrew P and Stmartin Lauren B
Current Estimated Value
Home Financials for this Owner
Home Financials are based on the most recent Mortgage that was taken out on this home.
Original Mortgage
$256,000
Outstanding Balance
$214,232
Interest Rate
3.89%
Mortgage Type
New Conventional
Estimated Equity
$396,193
Create a Home Valuation Report for This Property
The Home Valuation Report is an in-depth analysis detailing your home's value as well as a comparison with similar homes in the area
Home Values in the Area
Average Home Value in this Area
Purchase History
| Date | Buyer | Sale Price | Title Company |
|---|---|---|---|
| Stmartin Andrew P | $320,000 | -- |
Source: Public Records
Mortgage History
| Date | Status | Borrower | Loan Amount |
|---|---|---|---|
| Open | Stmartin Andrew P | $256,000 |
Source: Public Records
Tax History Compared to Growth
Tax History
| Year | Tax Paid | Tax Assessment Tax Assessment Total Assessment is a certain percentage of the fair market value that is determined by local assessors to be the total taxable value of land and additions on the property. | Land | Improvement |
|---|---|---|---|---|
| 2025 | $6,526 | $520,000 | $154,000 | $366,000 |
| 2024 | $6,272 | $492,700 | $154,000 | $338,700 |
| 2023 | $5,920 | $432,400 | $140,800 | $291,600 |
| 2022 | $5,651 | $391,100 | $134,600 | $256,500 |
| 2021 | $5,180 | $350,000 | $129,800 | $220,200 |
| 2020 | $5,042 | $346,300 | $126,200 | $220,100 |
| 2019 | $4,819 | $340,300 | $124,000 | $216,300 |
| 2018 | $4,688 | $316,300 | $120,600 | $195,700 |
| 2017 | $4,317 | $296,700 | $120,600 | $176,100 |
| 2016 | $4,073 | $274,800 | $118,800 | $156,000 |
| 2015 | $4,075 | $277,000 | $118,800 | $158,200 |
| 2014 | $3,775 | $254,200 | $113,200 | $141,000 |
Source: Public Records
Map
Nearby Homes
- 278 East St
- 16 George St Unit 9
- 231 Park St
- 109 Maple St Unit E3
- 164 Park St
- 157 Park St
- 37 School St
- 9 Parker Ct
- 63 Orange St
- 44 Mulberry St
- 21 Morey St
- 0 Sunflower Dr
- 10 Holman St Unit C
- 8 Holman St
- 6 & 6R Holman St
- 97 Dexter St
- 38 Springdale Ave
- 248 S Main St
- 19 Cherry Tree Ln
- 41 Garden St Unit A