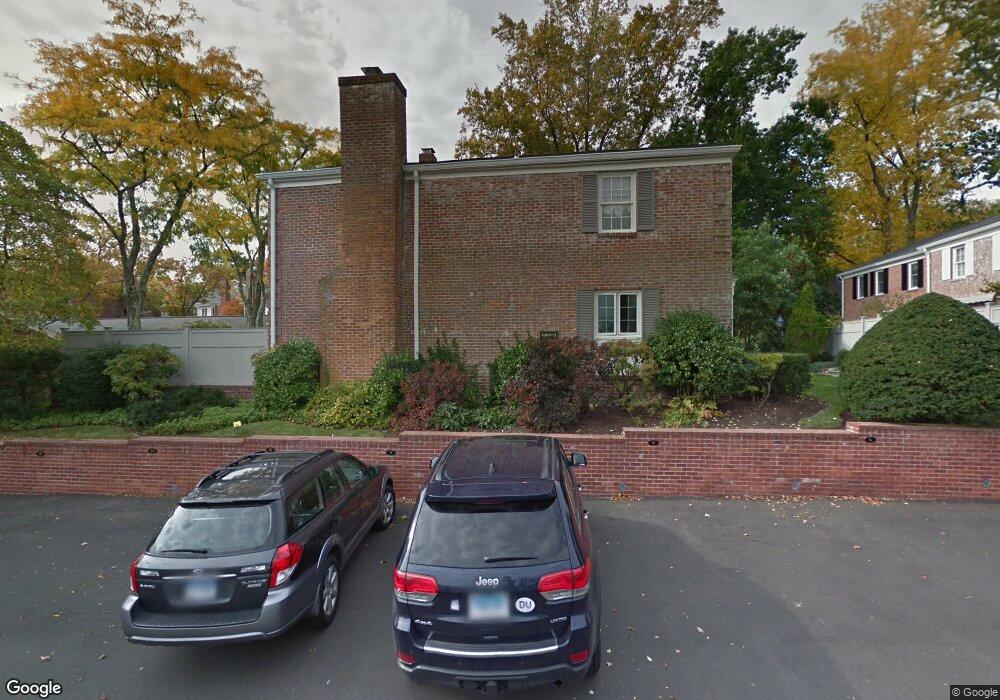
312 Elm St Unit 45 New Canaan, CT 06840
Estimated Value: $1,820,000 - $2,362,000
4
Beds
6
Baths
2,942
Sq Ft
$722/Sq Ft
Est. Value
About This Home
This home is located at 312 Elm St Unit 45, New Canaan, CT 06840 and is currently estimated at $2,123,951, approximately $721 per square foot. 312 Elm St Unit 45 is a home located in Fairfield County with nearby schools including West Elementary School, Saxe Middle School, and New Canaan High School.
Ownership History
Date
Name
Owned For
Owner Type
Purchase Details
Closed on
Aug 28, 2014
Sold by
Lear Andrew R and Lear William S
Bought by
Dowd Tr James F
Current Estimated Value
Purchase Details
Closed on
Jan 8, 2013
Sold by
Lear Dorothy S
Bought by
Lear Andrew R and Lear William S
Purchase Details
Closed on
Dec 9, 2011
Sold by
Dorothy S Lear Rt and Lear William S
Bought by
Dorothy S Lear T and Lear William S
Purchase Details
Closed on
Jun 12, 2000
Sold by
Hecker William J and Hecker Leslie H
Bought by
Lear Robert W and Lear Dorothy S
Home Financials for this Owner
Home Financials are based on the most recent Mortgage that was taken out on this home.
Original Mortgage
$800,000
Interest Rate
7.25%
Purchase Details
Closed on
Nov 25, 1998
Sold by
Barton James N and Barton Elizabeth H
Bought by
Hecker William J
Home Financials for this Owner
Home Financials are based on the most recent Mortgage that was taken out on this home.
Original Mortgage
$709,200
Interest Rate
6.5%
Create a Home Valuation Report for This Property
The Home Valuation Report is an in-depth analysis detailing your home's value as well as a comparison with similar homes in the area
Home Values in the Area
Average Home Value in this Area
Purchase History
| Date | Buyer | Sale Price | Title Company |
|---|---|---|---|
| Dowd Tr James F | $1,399,000 | -- | |
| Lear Andrew R | -- | -- | |
| Dorothy S Lear T | -- | -- | |
| Lear Robert W | $1,252,000 | -- | |
| Hecker William J | $886,610 | -- |
Source: Public Records
Mortgage History
| Date | Status | Borrower | Loan Amount |
|---|---|---|---|
| Open | Hecker William J | $1,125,000 | |
| Previous Owner | Hecker William J | $800,000 | |
| Previous Owner | Hecker William J | $709,200 |
Source: Public Records
Tax History Compared to Growth
Tax History
| Year | Tax Paid | Tax Assessment Tax Assessment Total Assessment is a certain percentage of the fair market value that is determined by local assessors to be the total taxable value of land and additions on the property. | Land | Improvement |
|---|---|---|---|---|
| 2025 | $19,610 | $1,174,950 | $0 | $1,174,950 |
| 2024 | $18,964 | $1,174,950 | $0 | $1,174,950 |
| 2023 | $18,734 | $989,100 | $0 | $989,100 |
| 2022 | $18,170 | $989,100 | $0 | $989,100 |
| 2021 | $17,962 | $989,100 | $0 | $989,100 |
| 2020 | $17,962 | $989,100 | $0 | $989,100 |
| 2019 | $18,041 | $989,100 | $0 | $989,100 |
| 2018 | $17,875 | $1,015,140 | $0 | $1,015,140 |
| 2017 | $17,551 | $1,015,140 | $0 | $1,015,140 |
| 2016 | $17,152 | $1,015,140 | $0 | $1,015,140 |
| 2015 | $14,775 | $892,080 | $0 | $892,080 |
| 2014 | $14,363 | $892,080 | $0 | $892,080 |
Source: Public Records
Map
Nearby Homes
- 66 Seminary St
- 197 Park St Unit 13
- 23 Mead St
- 160 Park St Unit 103
- 160 Park St Unit 104
- 254 Park St Unit 254
- 2 Mead St Unit 2
- 317 Park St
- 136 South Ave
- 15 Burtis Ave Unit Townhome D
- 15 Burtis Ave Unit West Penthouse B
- 15 Burtis Ave Unit Townhome A
- 15 Burtis Ave Unit East Plaza 203
- 42 Forest St Unit A
- 60 East Ave
- 64 East Ave
- 79 Locust Ave Unit 212
- 85 Locust Ave Unit 516
- 96 East Ave Unit C
- 180 Summer St
- 312 Elm St Unit 7
- 312 Elm St Unit 6
- 312 Elm St Unit 52
- 312 Elm St Unit 51
- 312 Elm St Unit 50
- 312 Elm St Unit 5
- 312 Elm St Unit 49
- 312 Elm St Unit 48
- 312 Elm St Unit 47
- 312 Elm St Unit 46
- 312 Elm St Unit 44
- 312 Elm St Unit 43
- 312 Elm St Unit 42
- 312 Elm St Unit 40
- 312 Elm St Unit 4
- 312 Elm St Unit 39
- 312 Elm St Unit 38
- 312 Elm St Unit 37
- 312 Elm St Unit 36
- 312 Elm St Unit 35