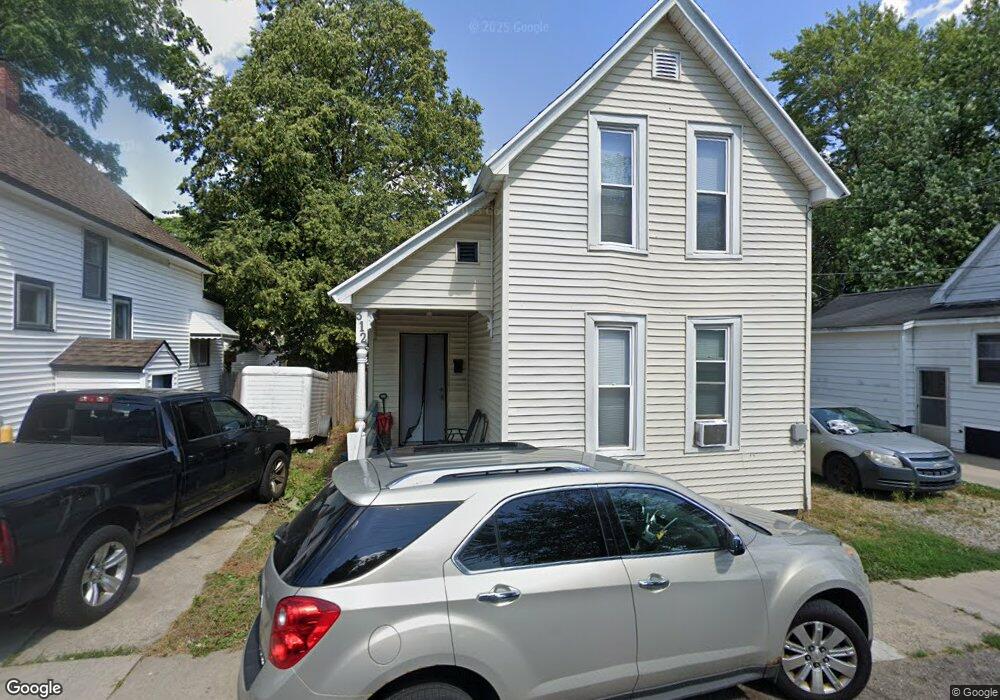
312 Fransman Place SW Grand Rapids, MI 49504
SWAN NeighborhoodEstimated Value: $149,000 - $227,000
3
Beds
1
Bath
1,118
Sq Ft
$161/Sq Ft
Est. Value
About This Home
This home is located at 312 Fransman Place SW, Grand Rapids, MI 49504 and is currently estimated at $179,573, approximately $160 per square foot. 312 Fransman Place SW is a home located in Kent County with nearby schools including Shawmut Hills School, Westwood Middle School, and Union High School.
Ownership History
Date
Name
Owned For
Owner Type
Purchase Details
Closed on
Apr 13, 2010
Sold by
Secretary Of Housing & Urban Development
Bought by
Sak Michael G
Current Estimated Value
Purchase Details
Closed on
Dec 24, 2009
Sold by
Citimortgage Inc
Bought by
Secretary Of Housing & Urban Development
Purchase Details
Closed on
Apr 29, 2009
Sold by
Godines Esmeralda and Gonzalez Rafael
Bought by
Citimortgage Inc
Purchase Details
Closed on
Nov 8, 2006
Sold by
Gonzalez Rafael
Bought by
Godines Esmeralda
Home Financials for this Owner
Home Financials are based on the most recent Mortgage that was taken out on this home.
Original Mortgage
$73,080
Interest Rate
6.41%
Mortgage Type
FHA
Purchase Details
Closed on
Mar 22, 1996
Sold by
Gerluis Gerluis L L and Gerluis Huston D
Bought by
Sak Huston D and Sak Michael G
Create a Home Valuation Report for This Property
The Home Valuation Report is an in-depth analysis detailing your home's value as well as a comparison with similar homes in the area
Home Values in the Area
Average Home Value in this Area
Purchase History
| Date | Buyer | Sale Price | Title Company |
|---|---|---|---|
| Sak Michael G | $12,750 | None Available | |
| Secretary Of Housing & Urban Development | -- | None Available | |
| Citimortgage Inc | $78,015 | None Available | |
| Godines Esmeralda | -- | Ottawa Kent Title Agency | |
| Sak Huston D | $9,000 | -- |
Source: Public Records
Mortgage History
| Date | Status | Borrower | Loan Amount |
|---|---|---|---|
| Previous Owner | Godines Esmeralda | $73,080 |
Source: Public Records
Tax History Compared to Growth
Tax History
| Year | Tax Paid | Tax Assessment Tax Assessment Total Assessment is a certain percentage of the fair market value that is determined by local assessors to be the total taxable value of land and additions on the property. | Land | Improvement |
|---|---|---|---|---|
| 2025 | $962 | $61,600 | $0 | $0 |
| 2024 | $962 | $55,900 | $0 | $0 |
| 2023 | $955 | $47,300 | $0 | $0 |
| 2022 | $907 | $41,900 | $0 | $0 |
| 2021 | $884 | $33,000 | $0 | $0 |
| 2020 | $855 | $26,500 | $0 | $0 |
| 2019 | $875 | $24,500 | $0 | $0 |
| 2018 | $848 | $18,000 | $0 | $0 |
| 2017 | $827 | $15,600 | $0 | $0 |
| 2016 | $832 | $15,500 | $0 | $0 |
| 2015 | $792 | $15,500 | $0 | $0 |
| 2013 | -- | $21,000 | $0 | $0 |
Source: Public Records
Map
Nearby Homes
- 1046 Pulawski St SW
- 1023 Pulawski St SW
- 205 Lane Ave SW
- 258 Richards Ave SW
- 856 Watson St SW
- 844 Watson St SW
- 914 Fulton St W
- 12 Valley Ave SW
- 827 Fulton St W
- 823 Fulton St W
- 1128 California St NW
- 1015 California St NW
- 922 Lake Michigan Dr NW
- 859 Lake Michigan Dr NW
- 748 Lake Michigan Dr NW
- 205 Lane Ave NW
- 452 Pleasant St SW
- 448 Pleasant St SW
- 444 Pleasant St SW
- 530 New Ave SW
- 308 Fransman Place SW
- 316 Fransman Place SW
- 320 Fransman Place SW
- 319 Krakow Place SW
- 315 Krakow Place SW
- 323 Krakow Place SW
- 1038 Butterworth St SW
- 1036 Butterworth St SW
- 1046 Butterworth St SW
- 1046 Butterworth St SW Unit 1048
- 1046 Butterworth St SW Unit 48
- 327 Krakow Place SW
- 1050 Butterworth St SW
- 1032 Butterworth St SW
- 331 Krakow Place SW
- 1024 Butterworth St SW
- 1052 Butterworth St SW
- 328 Fransman Place SW
- 1058 Butterworth St SW
- 323 O Keefe Place SW