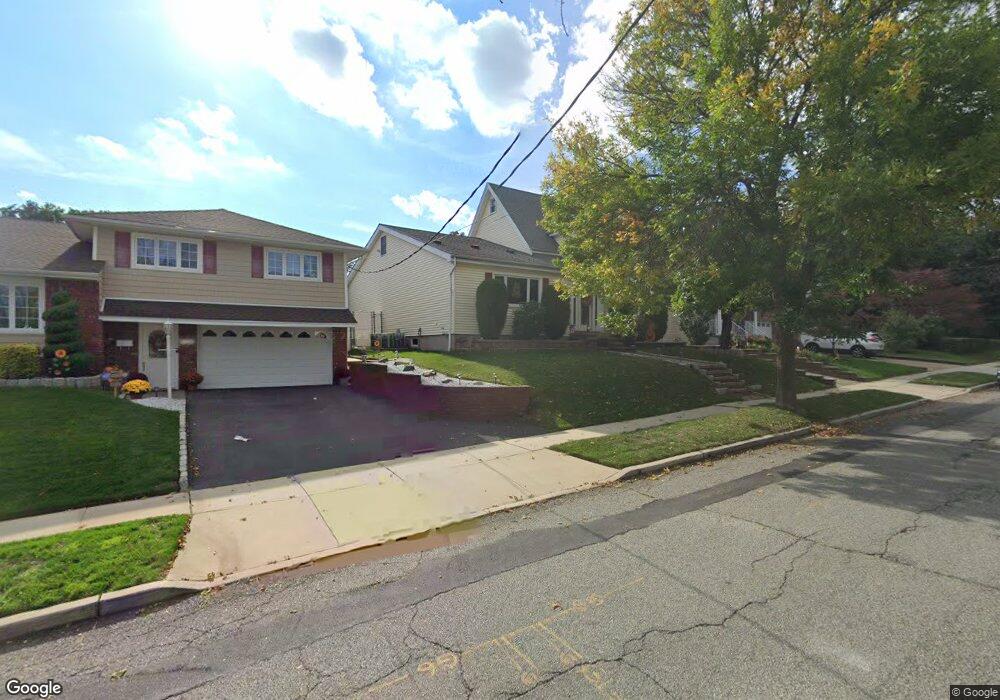
312 Kipp Ave Hasbrouck Heights, NJ 07604
Estimated Value: $840,061 - $980,000
--
Bed
--
Bath
2,552
Sq Ft
$353/Sq Ft
Est. Value
About This Home
This home is located at 312 Kipp Ave, Hasbrouck Heights, NJ 07604 and is currently estimated at $901,265, approximately $353 per square foot. 312 Kipp Ave is a home located in Bergen County with nearby schools including Hasbrouck Heights High School and Corpus Christi School.
Ownership History
Date
Name
Owned For
Owner Type
Purchase Details
Closed on
Jul 25, 2013
Sold by
Calabrese Dorothy T
Bought by
Bono Natale A and Bono Jennifer L
Current Estimated Value
Home Financials for this Owner
Home Financials are based on the most recent Mortgage that was taken out on this home.
Original Mortgage
$464,000
Outstanding Balance
$344,830
Interest Rate
4.45%
Mortgage Type
New Conventional
Estimated Equity
$556,435
Purchase Details
Closed on
Jan 29, 2010
Sold by
Nelson Thomas A and Dicarlo Nelson Francesca
Bought by
Calabrese Patrick and Calabrese Dorothy T
Home Financials for this Owner
Home Financials are based on the most recent Mortgage that was taken out on this home.
Original Mortgage
$330,600
Interest Rate
5.12%
Mortgage Type
Purchase Money Mortgage
Purchase Details
Closed on
Apr 21, 2000
Sold by
Estate Of Mabel A Brandeal
Bought by
Nelson Thomas A and Nelson Francesca Dicarlo
Home Financials for this Owner
Home Financials are based on the most recent Mortgage that was taken out on this home.
Original Mortgage
$90,000
Interest Rate
8.23%
Create a Home Valuation Report for This Property
The Home Valuation Report is an in-depth analysis detailing your home's value as well as a comparison with similar homes in the area
Home Values in the Area
Average Home Value in this Area
Purchase History
| Date | Buyer | Sale Price | Title Company |
|---|---|---|---|
| Bono Natale A | $580,000 | -- | |
| Calabrese Patrick | $551,000 | -- | |
| Nelson Thomas A | $240,000 | -- |
Source: Public Records
Mortgage History
| Date | Status | Borrower | Loan Amount |
|---|---|---|---|
| Open | Bono Natale A | $464,000 | |
| Previous Owner | Calabrese Patrick | $330,600 | |
| Previous Owner | Nelson Thomas A | $90,000 |
Source: Public Records
Tax History Compared to Growth
Tax History
| Year | Tax Paid | Tax Assessment Tax Assessment Total Assessment is a certain percentage of the fair market value that is determined by local assessors to be the total taxable value of land and additions on the property. | Land | Improvement |
|---|---|---|---|---|
| 2025 | $16,781 | $656,800 | $238,600 | $418,200 |
| 2024 | $16,245 | $656,800 | $238,600 | $418,200 |
| 2023 | $15,867 | $630,400 | $228,600 | $401,800 |
| 2022 | $15,867 | $589,400 | $208,600 | $380,800 |
| 2021 | $15,368 | $544,200 | $196,100 | $348,100 |
| 2020 | $15,070 | $524,000 | $186,100 | $337,900 |
| 2019 | $14,638 | $514,500 | $183,600 | $330,900 |
| 2018 | $14,405 | $505,100 | $181,100 | $324,000 |
| 2017 | $14,154 | $495,600 | $178,600 | $317,000 |
| 2016 | $14,246 | $469,400 | $168,600 | $300,800 |
| 2015 | $14,016 | $469,400 | $168,600 | $300,800 |
| 2014 | $13,631 | $469,400 | $168,600 | $300,800 |
Source: Public Records
Map
Nearby Homes
- 417 Franklin Ave
- 18 Hasbrouck Ave
- 208 Jefferson Ave
- 444 Washington Place
- 48 Hasbrouck Ave
- 8800 Boulevard Unit 5F
- 8800 Boulevard Unit 7K
- 8800 Boulevard Unit 4B
- 233 Lasalle Ave
- 74 Kipp Ave
- 140 Prospect St
- 35 Franklin Ave
- 243 Cleveland Ave
- 14 Jefferson Ave Unit 16
- 252 Paterson Ave
- 311 Harrison Ave
- 485 Hasbrouck Ave
- 38 Springfield Ave
- 2 Passaic Ave
- 30 Woodside Ave
- 316 Kipp Ave
- 304 Kipp Ave
- 320 Kipp Ave
- 144 Burton Ave
- 315 Jefferson Ave
- 311 Jefferson Ave
- 319 Jefferson Ave
- 301 Jefferson Ave
- 309 Kipp Ave
- 321 Jefferson Ave
- 313 Kipp Ave
- 313 Kipp Ave Unit 2nd
- 315 Kipp Ave
- 245 Terrace Ave
- 251 Terrace Ave
- 305 Kipp Ave
- 305 Kipp Ave Unit 1
- 321 Kipp Ave
- 247 Terrace Ave
- 247 Terrace Ave Unit 1