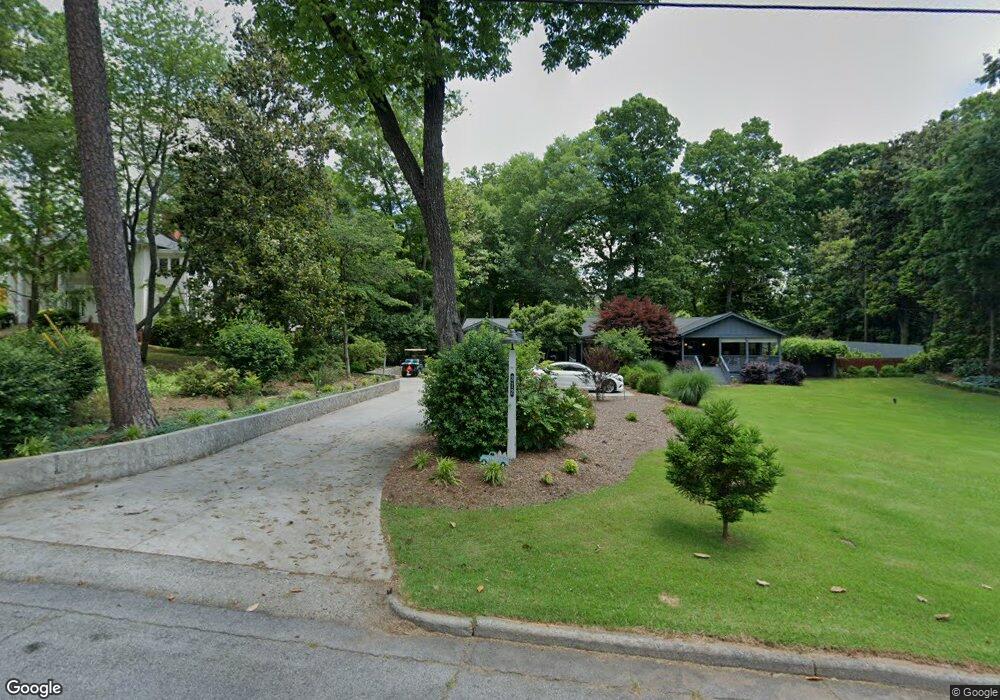
312 Kramer St Carrollton, GA 30117
Estimated Value: $337,000 - $439,000
3
Beds
3
Baths
2,579
Sq Ft
$152/Sq Ft
Est. Value
About This Home
This home is located at 312 Kramer St, Carrollton, GA 30117 and is currently estimated at $392,962, approximately $152 per square foot. 312 Kramer St is a home located in Carroll County with nearby schools including Carrollton Elementary School, Carrollton Upper Elementary School, and Carrollton Middle School.
Ownership History
Date
Name
Owned For
Owner Type
Purchase Details
Closed on
Dec 6, 2016
Sold by
Kress Jeffrey P
Bought by
Pyron Judy W
Current Estimated Value
Home Financials for this Owner
Home Financials are based on the most recent Mortgage that was taken out on this home.
Original Mortgage
$92,000
Outstanding Balance
$74,011
Interest Rate
3.57%
Mortgage Type
New Conventional
Estimated Equity
$318,951
Purchase Details
Closed on
Jul 2, 2006
Sold by
Not Provided
Bought by
Kress Jeffrey P
Purchase Details
Closed on
Jun 2, 2006
Sold by
Lorene Rowe
Bought by
Kress Bernard
Purchase Details
Closed on
Feb 18, 2000
Sold by
Robins Jerry R
Bought by
Kress Bernard and Kress Marilyn
Purchase Details
Closed on
Sep 7, 1999
Bought by
Robins Jerry R
Create a Home Valuation Report for This Property
The Home Valuation Report is an in-depth analysis detailing your home's value as well as a comparison with similar homes in the area
Home Values in the Area
Average Home Value in this Area
Purchase History
| Date | Buyer | Sale Price | Title Company |
|---|---|---|---|
| Pyron Judy W | $115,000 | -- | |
| Kress Jeffrey P | -- | -- | |
| Kress Jeffrey P | $150,000 | -- | |
| Kress Bernard | -- | -- | |
| Kress Bernard | $127,000 | -- | |
| Robins Jerry R | $29,000 | -- |
Source: Public Records
Mortgage History
| Date | Status | Borrower | Loan Amount |
|---|---|---|---|
| Open | Pyron Judy W | $92,000 |
Source: Public Records
Tax History
| Year | Tax Paid | Tax Assessment Tax Assessment Total Assessment is a certain percentage of the fair market value that is determined by local assessors to be the total taxable value of land and additions on the property. | Land | Improvement |
|---|---|---|---|---|
| 2025 | $905 | $159,750 | $58,805 | $100,945 |
| 2024 | $915 | $159,750 | $58,805 | $100,945 |
| 2023 | $899 | $150,699 | $58,806 | $91,893 |
| 2022 | $806 | $111,873 | $39,204 | $72,669 |
| 2021 | $714 | $91,294 | $29,016 | $62,278 |
| 2020 | $687 | $84,867 | $29,016 | $55,851 |
| 2019 | $683 | $80,206 | $29,016 | $51,190 |
| 2018 | $612 | $59,953 | $29,016 | $30,937 |
| 2017 | $1,384 | $53,646 | $29,016 | $24,630 |
| 2016 | $1,336 | $60,692 | $29,016 | $31,676 |
| 2015 | $1,293 | $45,873 | $15,872 | $30,002 |
| 2014 | $1,299 | $45,874 | $15,872 | $30,002 |
Source: Public Records
Map
Nearby Homes
- 310 Kramer St
- 0 Hwy 27 None N
- 27 South St
- 423 Clifton Terrace
- 135 Beaver St
- 301 Bradley St
- 106 Mara St
- 160 Watson St
- 219 Broad St
- 109 S Park St
- 111 Riversong Rd (Tract 26) Unit 55
- 209 Hill Dr
- 723 Sinclair Ln
- 725 Sinclair Ln
- 727 Sinclair Ln
- 406 Harmon Ave
- 119 Old Mill Ct
- 141 Bowen St
- 107 College St
- 205 Johnson Ave Unit 217
Your Personal Tour Guide
Ask me questions while you tour the home.