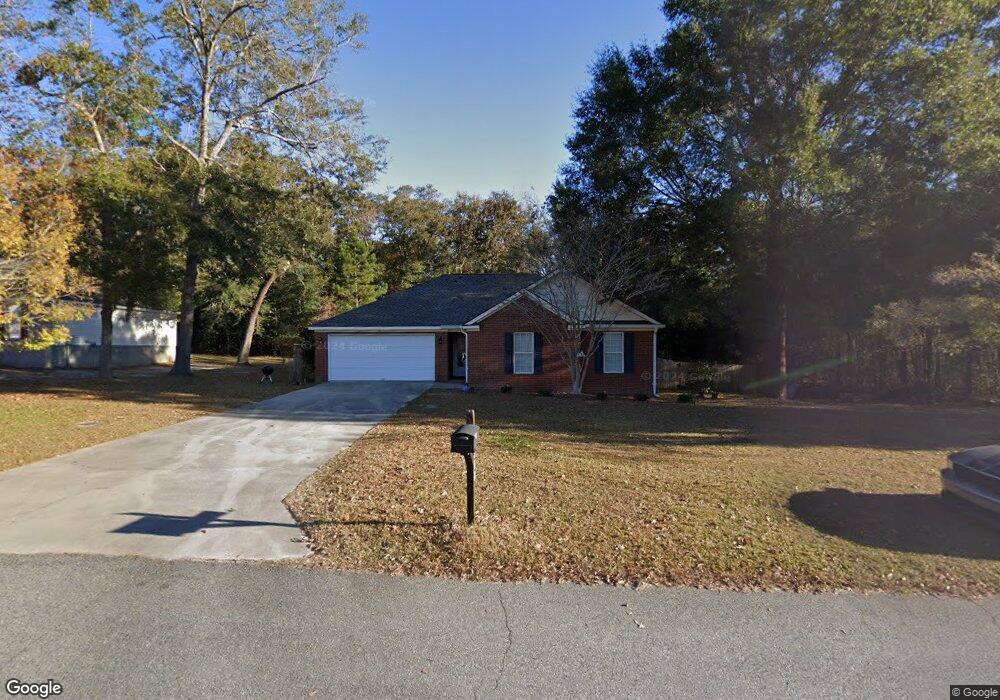
312 Mallard Pointe Dr Rincon, GA 31326
Estimated Value: $279,115 - $324,000
3
Beds
2
Baths
1,325
Sq Ft
$223/Sq Ft
Est. Value
About This Home
This home is located at 312 Mallard Pointe Dr, Rincon, GA 31326 and is currently estimated at $296,029, approximately $223 per square foot. 312 Mallard Pointe Dr is a home located in Effingham County with nearby schools including Ebenezer Elementary School, Ebenezer Middle School, and Effingham County High School.
Ownership History
Date
Name
Owned For
Owner Type
Purchase Details
Closed on
May 3, 2022
Sold by
Bierle Lisa M
Bought by
Higdon Kristen Marie
Current Estimated Value
Home Financials for this Owner
Home Financials are based on the most recent Mortgage that was taken out on this home.
Original Mortgage
$211,105
Outstanding Balance
$198,139
Interest Rate
4.49%
Mortgage Type
FHA
Estimated Equity
$97,890
Purchase Details
Closed on
Jul 10, 2017
Sold by
Kinsaul Sarah R
Bought by
Bierle Lisa M and Redmond Keith E
Home Financials for this Owner
Home Financials are based on the most recent Mortgage that was taken out on this home.
Original Mortgage
$145,319
Interest Rate
3.75%
Mortgage Type
FHA
Purchase Details
Closed on
Mar 31, 2010
Sold by
Bryan Howze Inc
Bought by
Kinsaul Sarah R
Purchase Details
Closed on
Feb 13, 2009
Sold by
Howze Paul W
Bought by
Bryan Howze Inc
Purchase Details
Closed on
Dec 31, 2008
Sold by
Gregg Howze Inc
Bought by
Howze Paul W
Create a Home Valuation Report for This Property
The Home Valuation Report is an in-depth analysis detailing your home's value as well as a comparison with similar homes in the area
Home Values in the Area
Average Home Value in this Area
Purchase History
| Date | Buyer | Sale Price | Title Company |
|---|---|---|---|
| Higdon Kristen Marie | $215,000 | -- | |
| Bierle Lisa M | $148,000 | -- | |
| Kinsaul Sarah R | $135,000 | -- | |
| Bryan Howze Inc | -- | -- | |
| Howze Paul W | -- | -- |
Source: Public Records
Mortgage History
| Date | Status | Borrower | Loan Amount |
|---|---|---|---|
| Open | Higdon Kristen Marie | $211,105 | |
| Previous Owner | Bierle Lisa M | $145,319 |
Source: Public Records
Tax History
| Year | Tax Paid | Tax Assessment Tax Assessment Total Assessment is a certain percentage of the fair market value that is determined by local assessors to be the total taxable value of land and additions on the property. | Land | Improvement |
|---|---|---|---|---|
| 2025 | $3,596 | $104,829 | $22,800 | $82,029 |
| 2024 | $3,596 | $91,280 | $22,800 | $68,480 |
| 2023 | $2,658 | $88,376 | $18,800 | $69,576 |
| 2022 | $2,396 | $71,307 | $17,600 | $53,707 |
| 2021 | $2,135 | $62,163 | $14,000 | $48,163 |
| 2020 | $2,149 | $63,402 | $12,000 | $51,402 |
| 2019 | $2,101 | $61,402 | $10,000 | $51,402 |
| 2018 | $1,748 | $48,763 | $6,800 | $41,963 |
| 2017 | $1,498 | $48,763 | $6,800 | $41,963 |
| 2016 | $1,474 | $52,815 | $11,200 | $41,615 |
| 2015 | -- | $53,615 | $12,000 | $41,615 |
| 2014 | -- | $44,415 | $2,800 | $41,615 |
| 2013 | -- | $49,614 | $8,000 | $41,614 |
Source: Public Records
Map
Nearby Homes
- 364 Long Pond Rd
- 650 Old Augusta Rd S
- 3072 Rincon Stillwell Rd
- 31 Grove Hollow Rd
- 16 Grove Hollow Rd
- 2830 Rincon-Stillwell Rd
- 22 Grove Hollow Rd
- 44 Grove Hollow Rd
- 19 Grove Hollow Rd
- 28 Grove Hollow Rd
- 15 Grove Hollow Rd
- 1633 Fort Howard Rd
- 363 Crosswinds Dr
- 361 Crosswinds Dr
- 427 Seabreeze Dr
- 180 Foxridge Ct
- 512 Windsong Dr
- 107 Acorn St
- 301 Cone St
- 329 Crosswinds Dr
- 312 Mallard Pointe Dr
- 314 Mallard Pointe Dr
- 308 Mallard Pointe Dr
- 316 Mallard Pointe Dr
- 317 Mallard Pointe Dr
- 319 Mallard Pointe Dr
- 315 Mallard Pointe Dr
- 321 Mallard Pointe Dr
- 318 Mallard Pointe Dr
- 306 Mallard Pointe Dr
- 313 Mallard Pointe Dr
- 323 Mallard Pointe Dr
- 107 Mallard Crossing
- 311 Mallard Pointe Dr
- 304 Mallard Pointe Dr
- 304 Mallard Pointe Dr Unit 27
- 103 Mallard Crossing
- 325 Mallard Pointe Dr
- 101 Mallard Crossing
- 309 Mallard Pointe Dr
Your Personal Tour Guide
Ask me questions while you tour the home.