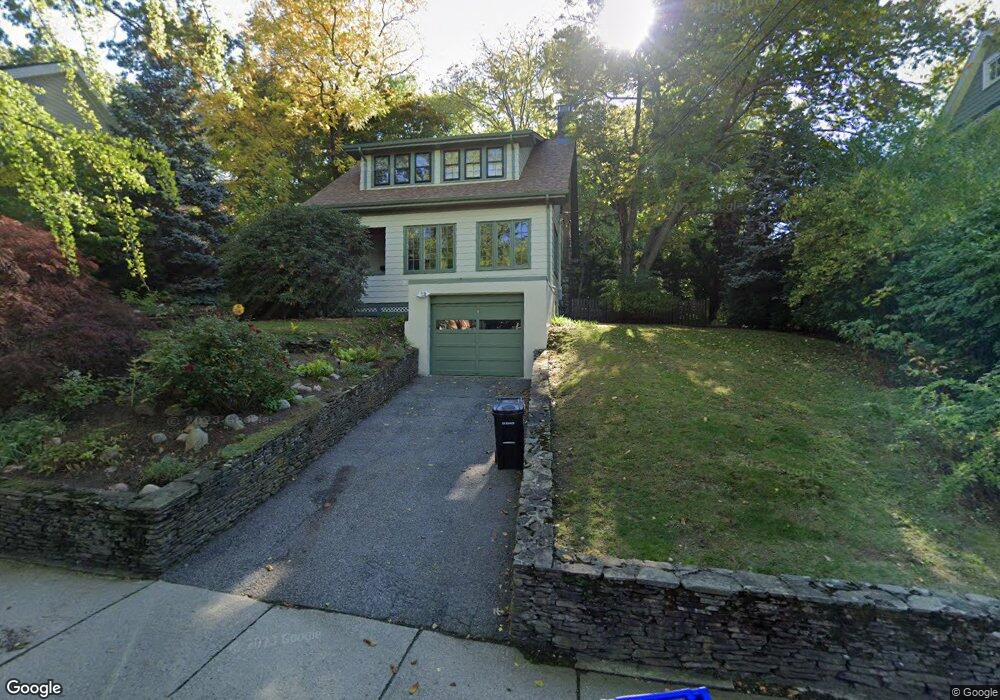
312 Mason Terrace Brookline, MA 02446
Washington Square NeighborhoodEstimated Value: $1,320,000 - $2,652,773
3
Beds
2
Baths
1,456
Sq Ft
$1,460/Sq Ft
Est. Value
About This Home
This home is located at 312 Mason Terrace, Brookline, MA 02446 and is currently estimated at $2,125,193, approximately $1,459 per square foot. 312 Mason Terrace is a home located in Norfolk County with nearby schools including Michael Driscoll, Brookline High School, and Boston Green Academy Horace Mann Charter School.
Ownership History
Date
Name
Owned For
Owner Type
Purchase Details
Closed on
Jun 10, 2019
Sold by
Beizer Janet L
Bought by
Janet L Beizer T
Current Estimated Value
Purchase Details
Closed on
Jul 11, 2002
Sold by
Palepu Krishna G
Bought by
Beizer Janet L
Home Financials for this Owner
Home Financials are based on the most recent Mortgage that was taken out on this home.
Original Mortgage
$380,000
Interest Rate
6.79%
Mortgage Type
Purchase Money Mortgage
Purchase Details
Closed on
Jun 15, 1998
Sold by
Cronin Denis P and Cronin Regina A
Bought by
Palepu Krishna G
Home Financials for this Owner
Home Financials are based on the most recent Mortgage that was taken out on this home.
Original Mortgage
$177,000
Interest Rate
7.11%
Mortgage Type
Purchase Money Mortgage
Purchase Details
Closed on
Mar 2, 1998
Sold by
Metanias Tr Nicholas and Metanias James
Bought by
Cronin Deins and Cronin Regina A
Home Financials for this Owner
Home Financials are based on the most recent Mortgage that was taken out on this home.
Original Mortgage
$252,000
Interest Rate
6.85%
Mortgage Type
Purchase Money Mortgage
Create a Home Valuation Report for This Property
The Home Valuation Report is an in-depth analysis detailing your home's value as well as a comparison with similar homes in the area
Home Values in the Area
Average Home Value in this Area
Purchase History
| Date | Buyer | Sale Price | Title Company |
|---|---|---|---|
| Janet L Beizer T | -- | -- | |
| Beizer Janet L | $892,000 | -- | |
| Palepu Krishna G | $530,000 | -- | |
| Cronin Deins | $280,000 | -- |
Source: Public Records
Mortgage History
| Date | Status | Borrower | Loan Amount |
|---|---|---|---|
| Previous Owner | Cronin Deins | $345,750 | |
| Previous Owner | Beizer Janet L | $380,000 | |
| Previous Owner | Cronin Deins | $177,000 | |
| Previous Owner | Cronin Deins | $252,000 |
Source: Public Records
Tax History Compared to Growth
Tax History
| Year | Tax Paid | Tax Assessment Tax Assessment Total Assessment is a certain percentage of the fair market value that is determined by local assessors to be the total taxable value of land and additions on the property. | Land | Improvement |
|---|---|---|---|---|
| 2025 | $22,145 | $2,243,700 | $1,552,000 | $691,700 |
| 2024 | $21,093 | $2,159,000 | $1,493,300 | $665,700 |
| 2023 | $19,343 | $1,940,100 | $1,300,000 | $640,100 |
| 2022 | $18,829 | $1,847,800 | $1,238,100 | $609,700 |
| 2021 | $17,412 | $1,776,700 | $1,190,500 | $586,200 |
| 2020 | $15,249 | $1,613,700 | $1,035,300 | $578,400 |
| 2019 | $14,401 | $1,536,900 | $986,000 | $550,900 |
| 2018 | $12,960 | $1,370,000 | $836,300 | $533,700 |
| 2017 | $12,770 | $1,292,500 | $789,000 | $503,500 |
| 2016 | $12,586 | $1,207,900 | $737,300 | $470,600 |
| 2015 | $10,830 | $1,014,000 | $574,200 | $439,800 |
| 2014 | $11,123 | $976,600 | $521,100 | $455,500 |
Source: Public Records
Map
Nearby Homes
- 285 Corey Rd Unit 7
- 239 Kelton St Unit 41
- 245 Kelton St Unit 21
- 152 Jordan Rd
- 152 Jordan Rd Unit (Lot A)
- 140 Columbia St Unit 1
- 150 Jordan Rd
- 150 Jordan Rd Unit (Lot B)
- 249 Corey Rd Unit 401
- 249 Corey Rd Unit 309
- 249 Corey Rd Unit 204
- 249 Corey Rd Unit 306
- 249 Corey Rd Unit 308
- 249 Corey Rd Unit 403
- 249 Corey Rd Unit 407PH
- 249 Corey Rd Unit 103
- 249 Corey Rd Unit 303
- 249 Corey Rd Unit 404
- 15 Walbridge St Unit 3
- 108 Columbia St Unit 1
- 306 Mason Terrace
- 318 Mason Terrace
- 302 Mason Terrace
- 322 Mason Terrace
- 137 Jordan Rd
- 141 Jordan Rd
- 133 Jordan Rd
- 147 Jordan Rd
- 315 Mason Terrace
- 127 Jordan Rd
- 296 Mason Terrace
- 305 Mason Terrace
- 328 Mason Terrace
- 153 Jordan Rd
- 325 Mason Terrace
- 325 Mason Terrace Unit All
- 325 Mason Terrace Unit 1
- 325 Mason Terrace Unit 325
- 301 Mason Terrace
- 327 Mason Terrace