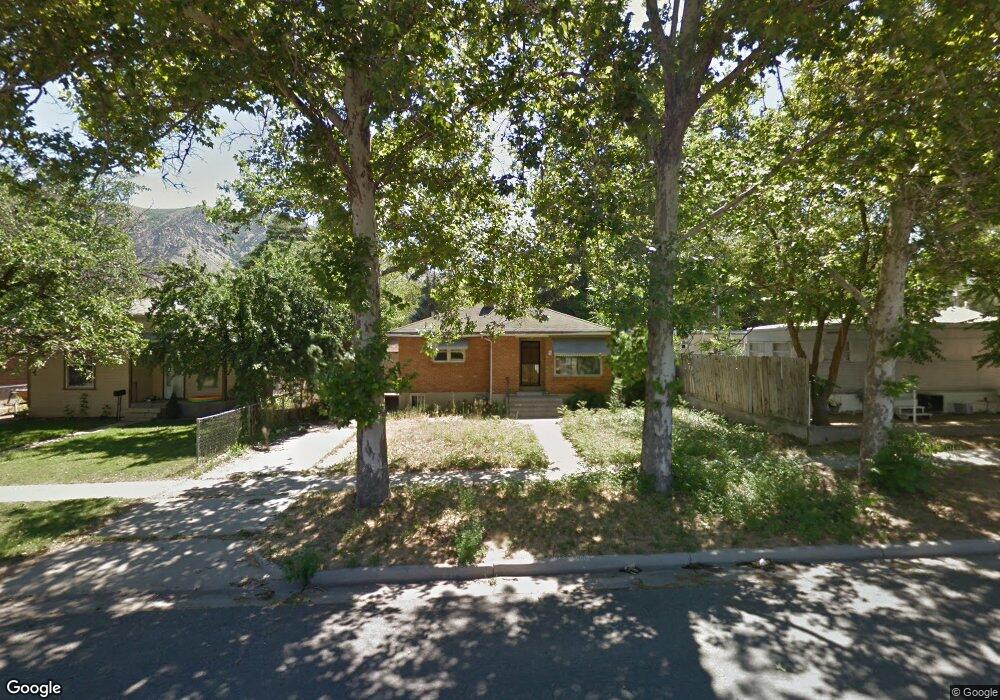
312 N 100 W Brigham City, UT 84302
Estimated Value: $356,000 - $416,000
4
Beds
2
Baths
2,000
Sq Ft
$187/Sq Ft
Est. Value
About This Home
This home is located at 312 N 100 W, Brigham City, UT 84302 and is currently estimated at $374,127, approximately $187 per square foot. 312 N 100 W is a home located in Box Elder County with nearby schools including Discovery School, Box Elder Middle School, and Adele C. Young Intermediate School.
Ownership History
Date
Name
Owned For
Owner Type
Purchase Details
Closed on
Dec 13, 2018
Sold by
Bluemountain I Llc
Bought by
Spaulding David Kingman and Spaulding Katie D
Current Estimated Value
Home Financials for this Owner
Home Financials are based on the most recent Mortgage that was taken out on this home.
Original Mortgage
$191,369
Outstanding Balance
$170,565
Interest Rate
5.4%
Mortgage Type
FHA
Estimated Equity
$203,562
Purchase Details
Closed on
Apr 13, 2018
Sold by
Phoenix Home Restorations Llc
Bought by
Blue Mountain I Llc
Purchase Details
Closed on
Feb 3, 2017
Sold by
Koch Jeff
Bought by
Phoenix Home Restorations Inc
Purchase Details
Closed on
Jun 26, 2012
Sold by
The Bank Of New York Mellon
Bought by
Phoenix Home Restorations Inc
Home Financials for this Owner
Home Financials are based on the most recent Mortgage that was taken out on this home.
Original Mortgage
$52,000
Interest Rate
3.63%
Mortgage Type
Future Advance Clause Open End Mortgage
Purchase Details
Closed on
Apr 10, 2012
Sold by
Scholes David and First Horizon Home Loan Corp
Bought by
The Bank Of New York Mellon and The Bank Of New York
Purchase Details
Closed on
Jan 13, 2006
Sold by
S & C Holdings Llc
Bought by
S & C Properties 2 Llc
Purchase Details
Closed on
Feb 4, 2005
Sold by
Scholes David
Bought by
S & C Holdings Llc
Purchase Details
Closed on
Jan 7, 2005
Sold by
Fieldstone Mortgage Co
Bought by
Scholes David and Clark Jared
Purchase Details
Closed on
Jan 6, 2005
Sold by
Scholes David and Clark Jared
Bought by
Advanced Title Ins Agnency Lc
Create a Home Valuation Report for This Property
The Home Valuation Report is an in-depth analysis detailing your home's value as well as a comparison with similar homes in the area
Home Values in the Area
Average Home Value in this Area
Purchase History
| Date | Buyer | Sale Price | Title Company |
|---|---|---|---|
| Spaulding David Kingman | -- | Founders Title Company Layto | |
| Blue Mountain I Llc | -- | Cottonwood Title Insurance A | |
| Phoenix Home Restorations Inc | -- | Cottonwood Title Insurance A | |
| Phoenix Home Restorations Inc | -- | First American Title Company | |
| The Bank Of New York Mellon | $24,900 | None Available | |
| S & C Properties 2 Llc | -- | None Available | |
| S & C Holdings Llc | -- | None Available | |
| Scholes David | -- | None Available | |
| Scholes David | -- | 1St American Title Ins Co | |
| Advanced Title Ins Agnency Lc | -- | Advanced Title Insurance Age |
Source: Public Records
Mortgage History
| Date | Status | Borrower | Loan Amount |
|---|---|---|---|
| Open | Spaulding David Kingman | $191,369 | |
| Previous Owner | Phoenix Home Restorations Inc | $52,000 | |
| Closed | Phoenix Home Restorations Inc | $0 |
Source: Public Records
Tax History Compared to Growth
Tax History
| Year | Tax Paid | Tax Assessment Tax Assessment Total Assessment is a certain percentage of the fair market value that is determined by local assessors to be the total taxable value of land and additions on the property. | Land | Improvement |
|---|---|---|---|---|
| 2025 | $1,712 | $336,223 | $105,000 | $231,223 |
| 2024 | $1,712 | $329,658 | $100,000 | $229,658 |
| 2023 | $1,729 | $340,740 | $95,000 | $245,740 |
| 2022 | $1,770 | $178,351 | $22,000 | $156,351 |
| 2021 | $1,363 | $200,937 | $40,000 | $160,937 |
| 2020 | $1,237 | $200,937 | $40,000 | $160,937 |
| 2019 | $1,161 | $100,332 | $22,000 | $78,332 |
| 2018 | $1,048 | $90,115 | $22,000 | $68,115 |
| 2017 | $1,008 | $150,030 | $16,500 | $120,030 |
| 2016 | $845 | $63,564 | $16,500 | $47,064 |
| 2015 | $790 | $59,285 | $16,500 | $42,785 |
| 2014 | $790 | $57,248 | $16,500 | $40,748 |
| 2013 | -- | $57,248 | $16,500 | $40,748 |
Source: Public Records
Map
Nearby Homes