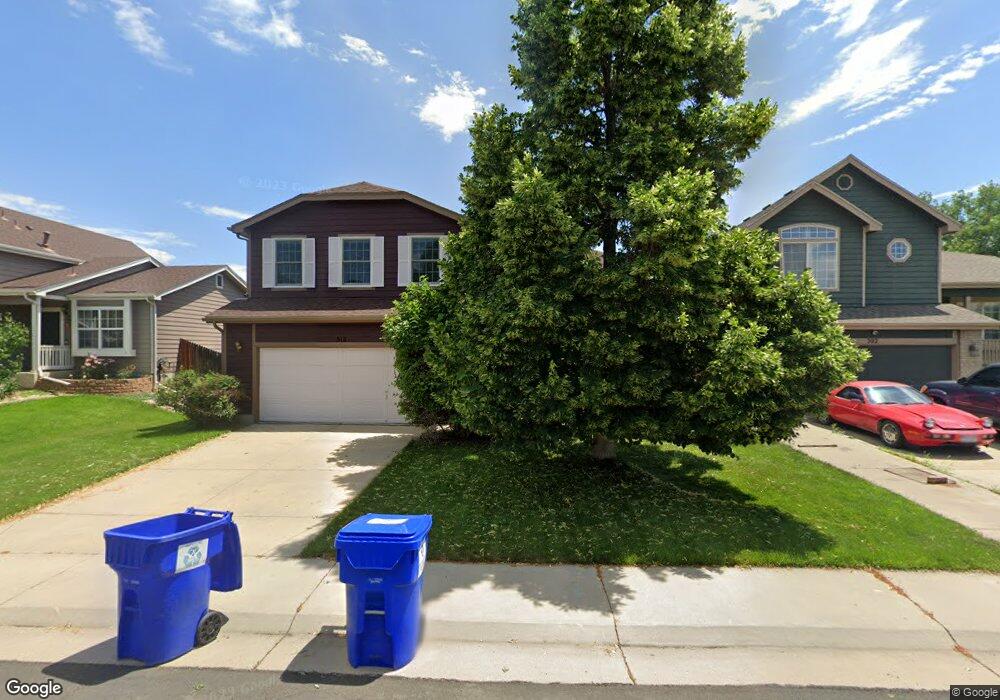
312 N 18th Ct Brighton, CO 80601
Estimated Value: $471,000 - $543,000
3
Beds
3
Baths
2,654
Sq Ft
$187/Sq Ft
Est. Value
About This Home
This home is located at 312 N 18th Ct, Brighton, CO 80601 and is currently estimated at $496,530, approximately $187 per square foot. 312 N 18th Ct is a home located in Adams County with nearby schools including Northeast Elementary School, Overland Trail Middle School, and Brighton High School.
Ownership History
Date
Name
Owned For
Owner Type
Purchase Details
Closed on
Jan 10, 2013
Sold by
Bhat Susan and Haneghan Bill
Bought by
Bhat Susan and Haneghan William J
Current Estimated Value
Home Financials for this Owner
Home Financials are based on the most recent Mortgage that was taken out on this home.
Original Mortgage
$157,115
Outstanding Balance
$108,628
Interest Rate
3.25%
Mortgage Type
FHA
Estimated Equity
$387,903
Purchase Details
Closed on
Jul 26, 2001
Sold by
Goik Raymond L and Hunt Kimberlynn M
Bought by
Bhat Susan and Haneghan Bill
Home Financials for this Owner
Home Financials are based on the most recent Mortgage that was taken out on this home.
Original Mortgage
$198,348
Interest Rate
7.07%
Mortgage Type
FHA
Purchase Details
Closed on
Jan 31, 2000
Sold by
Adare Homes Llc
Bought by
Goik Raymond L and Hunt Kimberlynn M
Home Financials for this Owner
Home Financials are based on the most recent Mortgage that was taken out on this home.
Original Mortgage
$40,000
Interest Rate
7.86%
Create a Home Valuation Report for This Property
The Home Valuation Report is an in-depth analysis detailing your home's value as well as a comparison with similar homes in the area
Home Values in the Area
Average Home Value in this Area
Purchase History
| Date | Buyer | Sale Price | Title Company |
|---|---|---|---|
| Bhat Susan | -- | None Available | |
| Bhat Susan | $201,150 | -- | |
| Goik Raymond L | $165,500 | North American Title Co |
Source: Public Records
Mortgage History
| Date | Status | Borrower | Loan Amount |
|---|---|---|---|
| Open | Bhat Susan | $157,115 | |
| Closed | Bhat Susan | $198,348 | |
| Previous Owner | Goik Raymond L | $40,000 |
Source: Public Records
Tax History Compared to Growth
Tax History
| Year | Tax Paid | Tax Assessment Tax Assessment Total Assessment is a certain percentage of the fair market value that is determined by local assessors to be the total taxable value of land and additions on the property. | Land | Improvement |
|---|---|---|---|---|
| 2024 | $2,731 | $30,500 | $5,940 | $24,560 |
| 2023 | $2,718 | $35,180 | $5,890 | $29,290 |
| 2022 | $1,721 | $23,670 | $5,630 | $18,040 |
| 2021 | $1,721 | $23,670 | $5,630 | $18,040 |
| 2020 | $1,689 | $24,250 | $5,790 | $18,460 |
| 2019 | $2,397 | $24,250 | $5,790 | $18,460 |
| 2018 | $2,006 | $20,290 | $5,040 | $15,250 |
| 2017 | $2,004 | $20,290 | $5,040 | $15,250 |
| 2016 | $1,787 | $18,030 | $2,870 | $15,160 |
| 2015 | $1,783 | $18,030 | $2,870 | $15,160 |
| 2014 | $1,345 | $13,800 | $2,390 | $11,410 |
Source: Public Records
Map
Nearby Homes
- 1726 Jennifer St
- 1514 Walnut Dr
- 1759 Jennifer St
- 1737 Jennifer St
- 1608 Jennifer St
- 1771 Jennifer St
- 1734 Windler St
- 1217 Eagle Dr
- 52 N 13th Ave
- 59 N 13th Ave
- 316 N 10th Ave
- 61 S 17th Avdr
- 111 County Road 2
- 63 S 22nd Ave Unit A1-B8
- 263 N 10th Ave
- 146 N 10th Ave
- 276 N 9th Ave
- 59 N 9th Ave Unit A & B
- 59 N 9th Ave Unit A and B
- 80 N 8th Ave