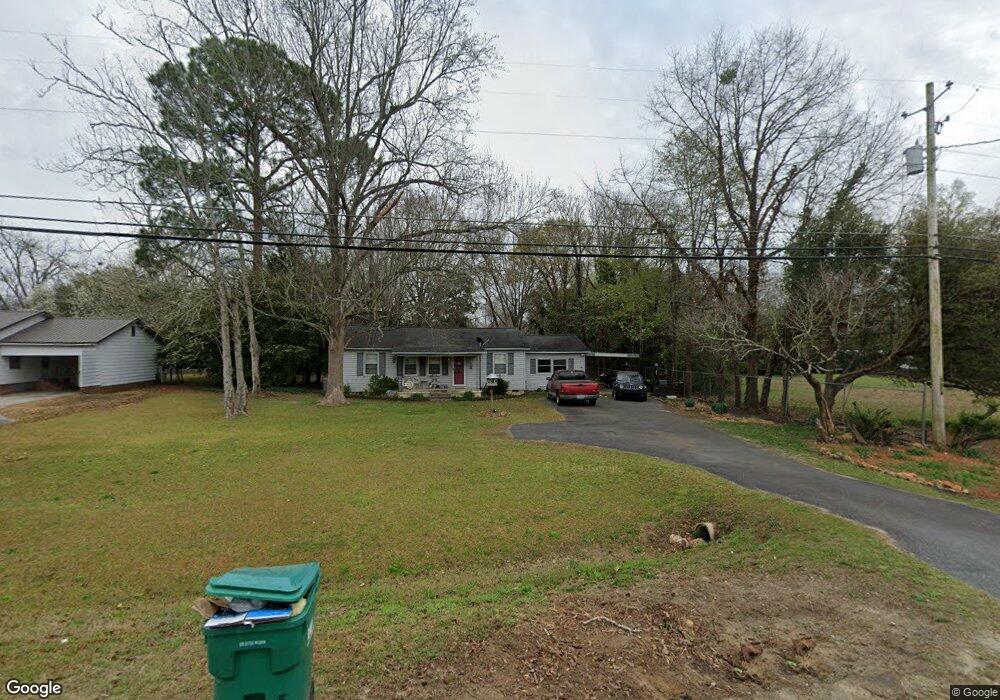
312 N 2nd St Cochran, GA 31014
Estimated Value: $131,000 - $166,000
3
Beds
2
Baths
1,626
Sq Ft
$88/Sq Ft
Est. Value
About This Home
This home is located at 312 N 2nd St, Cochran, GA 31014 and is currently estimated at $142,953, approximately $87 per square foot. 312 N 2nd St is a home located in Bleckley County with nearby schools including Bleckley County Primary School, Bleckley County Elementary School, and Bleckley Middle School.
Ownership History
Date
Name
Owned For
Owner Type
Purchase Details
Closed on
Nov 1, 2019
Sold by
Ledbetter Charles A
Bought by
Ledbetter Charles A and Ledbetter Brandy Perry
Current Estimated Value
Home Financials for this Owner
Home Financials are based on the most recent Mortgage that was taken out on this home.
Original Mortgage
$43,329
Interest Rate
3.65%
Purchase Details
Closed on
Aug 12, 2008
Sold by
Flanders James M
Bought by
Ledbetter Charles A
Home Financials for this Owner
Home Financials are based on the most recent Mortgage that was taken out on this home.
Original Mortgage
$63,000
Interest Rate
6.21%
Mortgage Type
New Conventional
Purchase Details
Closed on
Feb 21, 2002
Sold by
Partain Edgar L M
Bought by
Partain Anthony Lane
Purchase Details
Closed on
Mar 2, 2000
Sold by
Partain Edgar L M
Bought by
Partain Edgar L M
Create a Home Valuation Report for This Property
The Home Valuation Report is an in-depth analysis detailing your home's value as well as a comparison with similar homes in the area
Home Values in the Area
Average Home Value in this Area
Purchase History
| Date | Buyer | Sale Price | Title Company |
|---|---|---|---|
| Ledbetter Charles A | -- | -- | |
| Ledbetter Charles A | $70,000 | -- | |
| Partain Anthony Lane | -- | -- | |
| Partain Edgar L M | -- | -- |
Source: Public Records
Mortgage History
| Date | Status | Borrower | Loan Amount |
|---|---|---|---|
| Closed | Ledbetter Charles A | $43,329 | |
| Previous Owner | Ledbetter Charles A | $63,000 | |
| Previous Owner | Ledbetter Charles A | $5,000 |
Source: Public Records
Tax History Compared to Growth
Tax History
| Year | Tax Paid | Tax Assessment Tax Assessment Total Assessment is a certain percentage of the fair market value that is determined by local assessors to be the total taxable value of land and additions on the property. | Land | Improvement |
|---|---|---|---|---|
| 2024 | $1,357 | $37,440 | $920 | $36,520 |
| 2023 | $1,474 | $37,440 | $920 | $36,520 |
| 2022 | $847 | $33,120 | $920 | $32,200 |
| 2021 | $658 | $25,160 | $920 | $24,240 |
| 2020 | $660 | $25,160 | $920 | $24,240 |
| 2019 | $737 | $27,835 | $5,640 | $22,195 |
| 2018 | $1,125 | $27,835 | $5,640 | $22,195 |
| 2016 | $753 | $27,835 | $5,640 | $22,195 |
| 2015 | -- | $27,835 | $5,640 | $22,195 |
| 2014 | -- | $27,835 | $5,640 | $22,195 |
| 2013 | -- | $27,835 | $5,640 | $22,195 |
Source: Public Records
Map
Nearby Homes