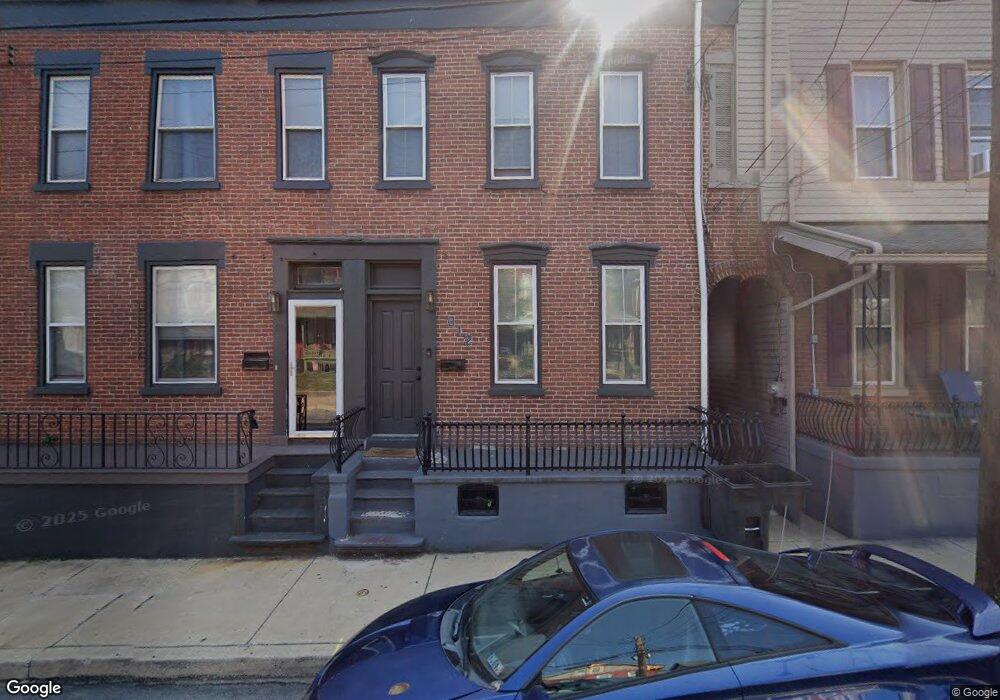
312 N 3rd St Columbia, PA 17512
Estimated Value: $189,663 - $259,000
3
Beds
1
Bath
1,758
Sq Ft
$125/Sq Ft
Est. Value
About This Home
This home is located at 312 N 3rd St, Columbia, PA 17512 and is currently estimated at $219,166, approximately $124 per square foot. 312 N 3rd St is a home located in Lancaster County with nearby schools including Columbia Middle School, Columbia High School, and Our Lady of the Angels School.
Ownership History
Date
Name
Owned For
Owner Type
Purchase Details
Closed on
Apr 25, 2019
Sold by
Pletz Peggy
Bought by
Qp Invest Real Estate Group Llc
Current Estimated Value
Purchase Details
Closed on
Feb 12, 2014
Sold by
Pletz Peggy and Goldinger Peggy
Bought by
Pletz Peggy
Home Financials for this Owner
Home Financials are based on the most recent Mortgage that was taken out on this home.
Original Mortgage
$55,400
Interest Rate
4.5%
Mortgage Type
New Conventional
Purchase Details
Closed on
Aug 25, 2006
Sold by
Goldinger Chris D
Bought by
Goldinger Chris D and Goldinger Peggy
Home Financials for this Owner
Home Financials are based on the most recent Mortgage that was taken out on this home.
Original Mortgage
$53,900
Interest Rate
6.83%
Mortgage Type
New Conventional
Create a Home Valuation Report for This Property
The Home Valuation Report is an in-depth analysis detailing your home's value as well as a comparison with similar homes in the area
Home Values in the Area
Average Home Value in this Area
Purchase History
| Date | Buyer | Sale Price | Title Company |
|---|---|---|---|
| Qp Invest Real Estate Group Llc | $84,386 | None Available | |
| Pletz Peggy | -- | Lsi Title Agency Inc | |
| Goldinger Chris D | -- | None Available |
Source: Public Records
Mortgage History
| Date | Status | Borrower | Loan Amount |
|---|---|---|---|
| Previous Owner | Pletz Peggy | $55,400 | |
| Previous Owner | Goldinger Chris D | $53,900 |
Source: Public Records
Tax History Compared to Growth
Tax History
| Year | Tax Paid | Tax Assessment Tax Assessment Total Assessment is a certain percentage of the fair market value that is determined by local assessors to be the total taxable value of land and additions on the property. | Land | Improvement |
|---|---|---|---|---|
| 2025 | $2,926 | $78,300 | $22,800 | $55,500 |
| 2024 | $2,926 | $78,300 | $22,800 | $55,500 |
| 2023 | $2,926 | $78,300 | $22,800 | $55,500 |
| 2022 | $2,926 | $78,300 | $22,800 | $55,500 |
| 2021 | $2,926 | $78,300 | $22,800 | $55,500 |
| 2020 | $2,926 | $78,300 | $22,800 | $55,500 |
| 2019 | $2,876 | $78,300 | $22,800 | $55,500 |
| 2018 | $2,021 | $78,300 | $22,800 | $55,500 |
| 2017 | $3,454 | $84,100 | $15,000 | $69,100 |
| 2016 | $3,454 | $84,100 | $15,000 | $69,100 |
| 2015 | $987 | $84,100 | $15,000 | $69,100 |
| 2014 | $2,071 | $84,100 | $15,000 | $69,100 |
Source: Public Records
Map
Nearby Homes