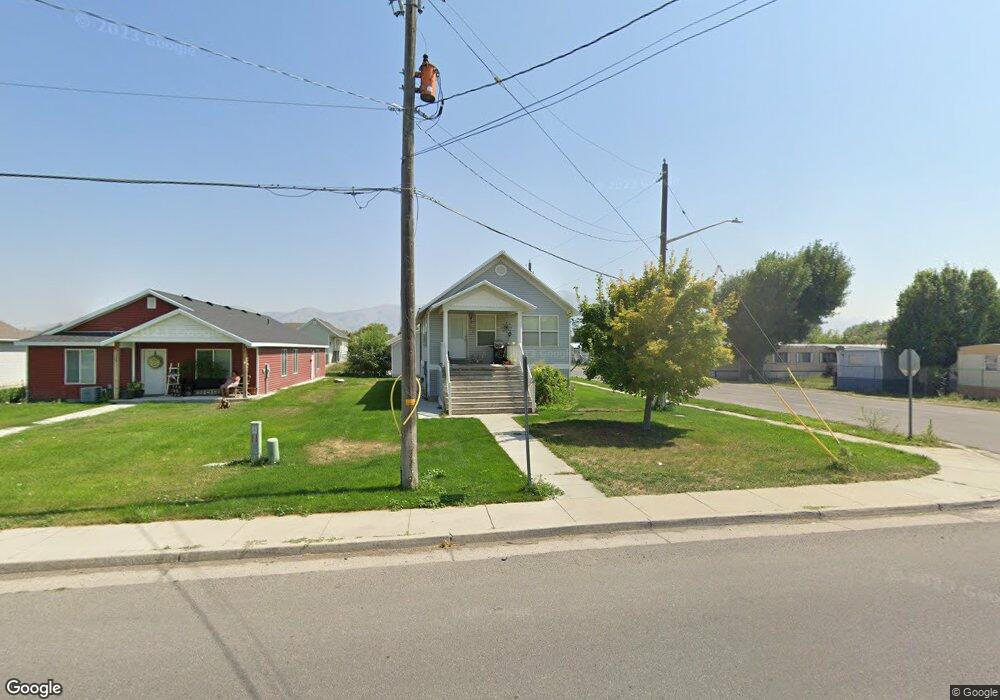
312 N 400 W Tremonton, UT 84337
Estimated Value: $347,009 - $403,000
--
Bed
2
Baths
1,064
Sq Ft
$350/Sq Ft
Est. Value
About This Home
This home is located at 312 N 400 W, Tremonton, UT 84337 and is currently estimated at $372,002, approximately $349 per square foot. 312 N 400 W is a home located in Box Elder County with nearby schools including North Park School, Alice C. Harris Intermediate School, and Bear River Middle School.
Ownership History
Date
Name
Owned For
Owner Type
Purchase Details
Closed on
Nov 26, 2014
Sold by
Utah Housing Corporation
Bought by
Losee John A
Current Estimated Value
Home Financials for this Owner
Home Financials are based on the most recent Mortgage that was taken out on this home.
Original Mortgage
$82,500
Outstanding Balance
$63,194
Interest Rate
3.92%
Mortgage Type
New Conventional
Estimated Equity
$308,808
Purchase Details
Closed on
Nov 20, 2014
Sold by
Utah Housing Corporation
Bought by
Losee John A
Home Financials for this Owner
Home Financials are based on the most recent Mortgage that was taken out on this home.
Original Mortgage
$82,500
Outstanding Balance
$63,194
Interest Rate
3.92%
Mortgage Type
New Conventional
Estimated Equity
$308,808
Purchase Details
Closed on
May 21, 2014
Sold by
Bear River Crown Llc
Bought by
Utah Housing Corp
Create a Home Valuation Report for This Property
The Home Valuation Report is an in-depth analysis detailing your home's value as well as a comparison with similar homes in the area
Home Values in the Area
Average Home Value in this Area
Purchase History
| Date | Buyer | Sale Price | Title Company |
|---|---|---|---|
| Losee John A | -- | American Secure Title Insura | |
| Losee John A | -- | First American Title Co | |
| Utah Housing Corp | -- | First American Title Co Llc |
Source: Public Records
Mortgage History
| Date | Status | Borrower | Loan Amount |
|---|---|---|---|
| Open | Losee John A | $82,500 | |
| Closed | Losee John A | $82,500 |
Source: Public Records
Tax History Compared to Growth
Tax History
| Year | Tax Paid | Tax Assessment Tax Assessment Total Assessment is a certain percentage of the fair market value that is determined by local assessors to be the total taxable value of land and additions on the property. | Land | Improvement |
|---|---|---|---|---|
| 2025 | $2,109 | $360,094 | $105,000 | $255,094 |
| 2024 | $2,109 | $357,758 | $105,000 | $252,758 |
| 2023 | $2,055 | $342,314 | $100,000 | $242,314 |
| 2022 | $1,807 | $311,957 | $30,000 | $281,957 |
| 2021 | $1,488 | $189,782 | $30,000 | $159,782 |
| 2020 | $1,255 | $189,782 | $30,000 | $159,782 |
| 2019 | $1,168 | $0 | $0 | $0 |
| 2018 | $665 | $49,887 | $13,750 | $36,137 |
| 2017 | $698 | $90,703 | $13,750 | $65,703 |
| 2016 | $690 | $48,166 | $13,750 | $34,416 |
| 2015 | $637 | $45,037 | $13,750 | $31,287 |
| 2014 | $637 | $43,547 | $13,750 | $29,797 |
| 2013 | -- | $43,548 | $13,338 | $30,210 |
Source: Public Records
Map
Nearby Homes