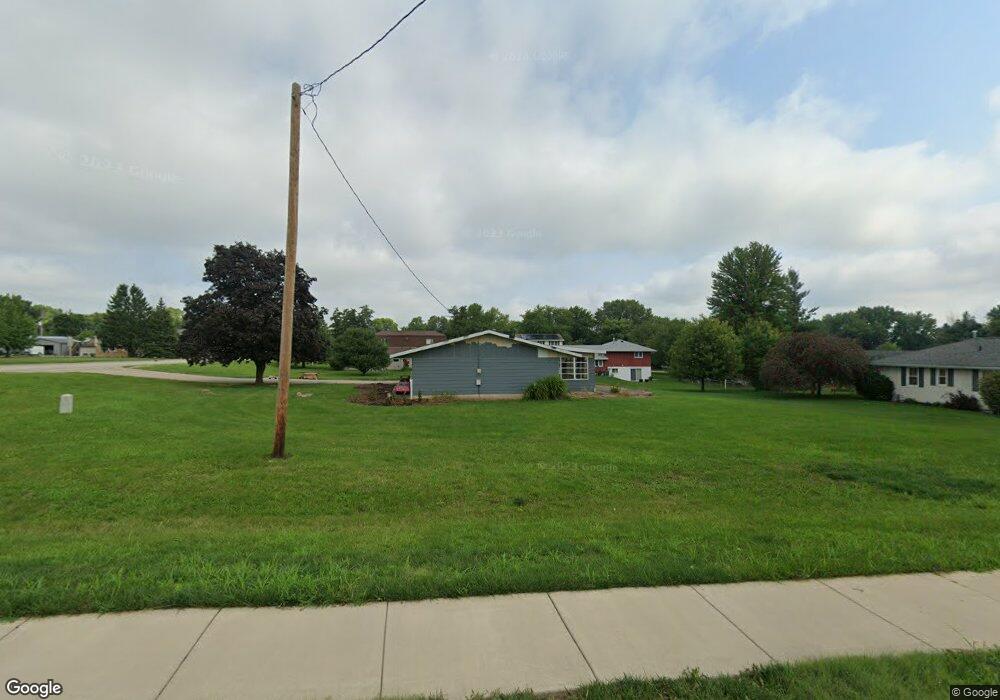
312 N 4th St Dunlap, IL 61525
Estimated Value: $140,000 - $217,000
3
Beds
1
Bath
1,120
Sq Ft
$146/Sq Ft
Est. Value
About This Home
This home is located at 312 N 4th St, Dunlap, IL 61525 and is currently estimated at $163,769, approximately $146 per square foot. 312 N 4th St is a home located in Peoria County with nearby schools including Dunlap Grade School, Dunlap Valley Middle School, and Dunlap High School.
Ownership History
Date
Name
Owned For
Owner Type
Purchase Details
Closed on
Oct 17, 2025
Sold by
Sheriff Of Peoria County Illinois
Bought by
F Street Investments Llc
Current Estimated Value
Purchase Details
Closed on
Jul 5, 2023
Sold by
Monge Brian James
Bought by
S & E Morris Property Investment Group Llc
Home Financials for this Owner
Home Financials are based on the most recent Mortgage that was taken out on this home.
Original Mortgage
$113,500
Interest Rate
6.57%
Mortgage Type
New Conventional
Purchase Details
Closed on
May 26, 2023
Sold by
Rocket Mortgage Llc
Bought by
Monge Brian James
Home Financials for this Owner
Home Financials are based on the most recent Mortgage that was taken out on this home.
Original Mortgage
$113,500
Interest Rate
6.57%
Mortgage Type
New Conventional
Purchase Details
Closed on
Mar 16, 2023
Sold by
Judicial Sales Corporation
Bought by
Rocket Mortgage Llc
Create a Home Valuation Report for This Property
The Home Valuation Report is an in-depth analysis detailing your home's value as well as a comparison with similar homes in the area
Home Values in the Area
Average Home Value in this Area
Purchase History
| Date | Buyer | Sale Price | Title Company |
|---|---|---|---|
| F Street Investments Llc | -- | None Listed On Document | |
| S & E Morris Property Investment Group Llc | $115,000 | None Listed On Document | |
| Monge Brian James | $75,000 | Premier Title | |
| Rocket Mortgage Llc | -- | -- |
Source: Public Records
Mortgage History
| Date | Status | Borrower | Loan Amount |
|---|---|---|---|
| Previous Owner | S & E Morris Property Investment Group Llc | $113,500 | |
| Previous Owner | S & E Morris Property Investment Group Llc | $66,250 |
Source: Public Records
Tax History Compared to Growth
Tax History
| Year | Tax Paid | Tax Assessment Tax Assessment Total Assessment is a certain percentage of the fair market value that is determined by local assessors to be the total taxable value of land and additions on the property. | Land | Improvement |
|---|---|---|---|---|
| 2024 | $3,177 | $44,240 | $10,620 | $33,620 |
| 2023 | $3,012 | $41,740 | $10,020 | $31,720 |
| 2022 | $2,815 | $38,670 | $9,300 | $29,370 |
| 2021 | $2,270 | $36,830 | $8,860 | $27,970 |
| 2020 | $2,213 | $35,760 | $8,600 | $27,160 |
| 2019 | $2,223 | $36,490 | $8,780 | $27,710 |
| 2018 | $2,244 | $37,180 | $8,950 | $28,230 |
| 2017 | $2,378 | $38,730 | $9,320 | $29,410 |
| 2016 | $2,284 | $38,730 | $9,320 | $29,410 |
| 2015 | $2,282 | $37,240 | $8,960 | $28,280 |
| 2014 | $2,265 | $37,810 | $9,100 | $28,710 |
| 2013 | -- | $37,600 | $9,460 | $28,140 |
Source: Public Records
Map
Nearby Homes
- 408 N 3rd St
- 311 N 2nd St
- 504 N 4th St
- 312 S 4th St
- Lot 136 French Dr
- 427 W Westfield Ct
- LOT 209 Copperpoint Dr
- LOT 208 Copperpoint Dr
- LOT 212 Copperpoint Dr
- LOT 204 W Salem School Ct
- 5821 W Dickison Cemetery Rd
- 11801 N Deerfield Dr
- 11518 N Nettle Creek Dr
- 11417 N Route 91 Rd
- 7320 W Akron Rd
- 11428 N Boulder Creek Ct
- 11227 N Stone Creek Dr
- 2203 W Augusta Dr
- 2218 W Augusta Dr
- 2247 W Augusta Dr