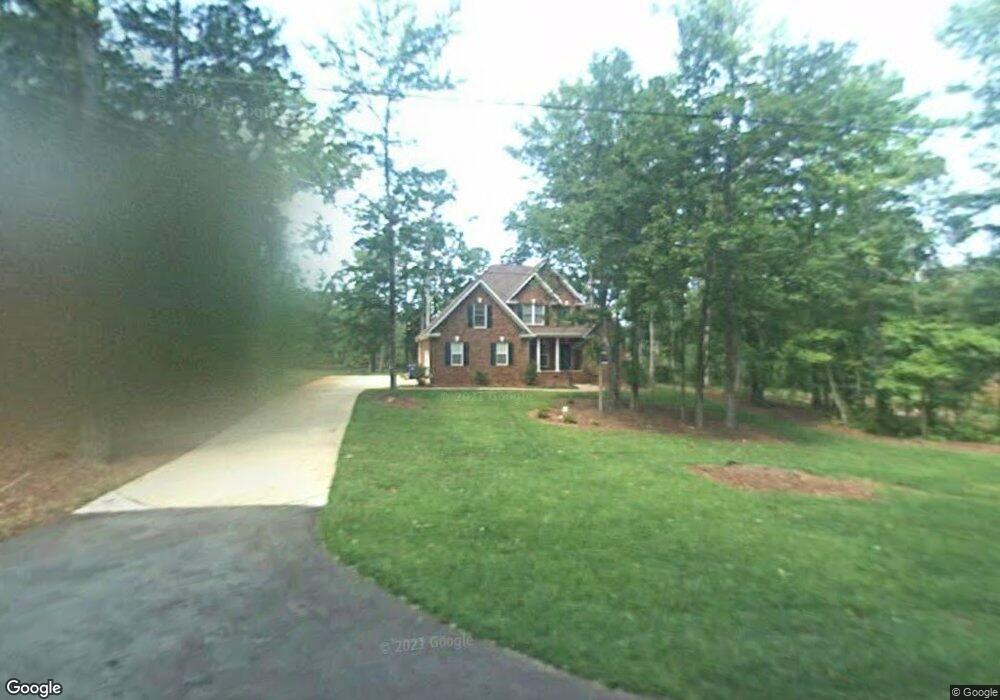
312 Old Forge Rd Chapin, SC 29036
Estimated Value: $465,514 - $597,000
3
Beds
3
Baths
2,312
Sq Ft
$226/Sq Ft
Est. Value
About This Home
This home is located at 312 Old Forge Rd, Chapin, SC 29036 and is currently estimated at $523,379, approximately $226 per square foot. 312 Old Forge Rd is a home located in Lexington County with nearby schools including Lake Murray Elementary School, Chapin Intermediate, and Chapin High School.
Ownership History
Date
Name
Owned For
Owner Type
Purchase Details
Closed on
Aug 14, 2013
Sold by
Collins Henry Brett and Collins Amy P
Bought by
Mccown James R and Mccown Christine G
Current Estimated Value
Home Financials for this Owner
Home Financials are based on the most recent Mortgage that was taken out on this home.
Original Mortgage
$270,595
Outstanding Balance
$200,426
Interest Rate
4.29%
Mortgage Type
VA
Estimated Equity
$322,953
Purchase Details
Closed on
Jul 25, 2005
Sold by
Lowcountry Builders Inc
Bought by
Collins Henry Brett and Collins Amy P
Home Financials for this Owner
Home Financials are based on the most recent Mortgage that was taken out on this home.
Original Mortgage
$259,811
Interest Rate
5.51%
Mortgage Type
New Conventional
Purchase Details
Closed on
Dec 15, 2004
Sold by
Parker Hugh L and Parker Betty H
Bought by
Lowcountry Builders Inc
Create a Home Valuation Report for This Property
The Home Valuation Report is an in-depth analysis detailing your home's value as well as a comparison with similar homes in the area
Home Values in the Area
Average Home Value in this Area
Purchase History
| Date | Buyer | Sale Price | Title Company |
|---|---|---|---|
| Mccown James R | $264,900 | -- | |
| Collins Henry Brett | $273,486 | -- | |
| Lowcountry Builders Inc | $42,500 | -- |
Source: Public Records
Mortgage History
| Date | Status | Borrower | Loan Amount |
|---|---|---|---|
| Open | Mccown James R | $270,595 | |
| Previous Owner | Collins Henry Brett | $259,811 |
Source: Public Records
Tax History
| Year | Tax Paid | Tax Assessment Tax Assessment Total Assessment is a certain percentage of the fair market value that is determined by local assessors to be the total taxable value of land and additions on the property. | Land | Improvement |
|---|---|---|---|---|
| 2024 | $2,068 | $12,559 | $1,800 | $10,759 |
| 2023 | $1,922 | $12,559 | $1,800 | $10,759 |
| 2022 | $1,939 | $12,559 | $1,800 | $10,759 |
| 2020 | $2,031 | $12,559 | $1,800 | $10,759 |
| 2019 | $1,867 | $11,347 | $1,796 | $9,551 |
| 2018 | $1,643 | $11,347 | $1,796 | $9,551 |
| 2017 | $1,601 | $11,347 | $1,796 | $9,551 |
| 2016 | $1,533 | $10,596 | $1,796 | $8,800 |
| 2014 | $1,527 | $10,596 | $1,796 | $8,800 |
| 2013 | -- | $11,050 | $1,730 | $9,320 |
Source: Public Records
Map
Nearby Homes
- 435 Whits End
- 345 Rising Stream Way
- 343 Rising Stream Way
- 407 Rising Stream Way
- 337 Rising Stream Way
- 415 Rising Stream Way
- 414 Rising Stream Way
- 403 Rising Stream Way
- 419 Rising Stream Way
- 940 Willow Cove Rd
- 533 Mitscher Way
- 427 Rising Stream Way
- 314 Rising Stream Way
- 516 Mitscher Way
- 306 Rising Stream Way
- 302 Rising Stream Way
- 454 Brookridge Dr
- 734 Autumn Shiloh Dr
- 932 Trident Maple Ln
- 603 Riverdale Ct
- 318 Old Forge Rd
- 246 Old Forge Rd
- 324 Old Forge Rd
- 240 Old Forge Rd
- 444 Jaybird Trail
- 330 Old Forge Rd
- 111 Haywain Dr
- 219 Hilton View Ct
- 336 Old Forge Rd
- 154 Hilton View Dr
- 121 Haywain Dr
- 223 Hilton View Ct
- 0 Hair Point
- 311 Hair Point
- 215 Hilton View Ct
- 209 Hilton View Ct
- 142 Hilton View Dr
- 400 Old Forge Rd
- 227 Hilton View Ct
- 160 Hilton View Dr
Your Personal Tour Guide
Ask me questions while you tour the home.