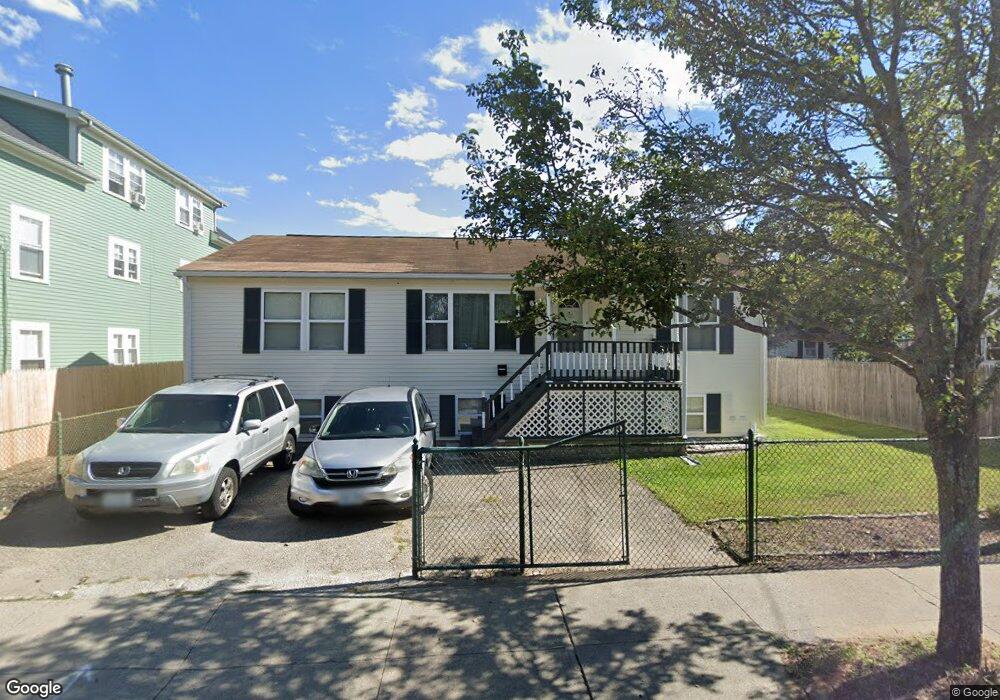
312 Public St Providence, RI 02905
Lower South Providence NeighborhoodEstimated Value: $391,000 - $504,000
3
Beds
2
Baths
1,125
Sq Ft
$395/Sq Ft
Est. Value
About This Home
This home is located at 312 Public St, Providence, RI 02905 and is currently estimated at $444,602, approximately $395 per square foot. 312 Public St is a home located in Providence County with nearby schools including The Hope Academy, SouthSide Elementary Charter, and Bishop Mcvinney Elementary School.
Ownership History
Date
Name
Owned For
Owner Type
Purchase Details
Closed on
Dec 5, 2008
Sold by
Costa Roland C Est
Bought by
Reyes Yamilet
Current Estimated Value
Home Financials for this Owner
Home Financials are based on the most recent Mortgage that was taken out on this home.
Original Mortgage
$114,468
Outstanding Balance
$75,251
Interest Rate
6.11%
Mortgage Type
Purchase Money Mortgage
Estimated Equity
$369,351
Purchase Details
Closed on
Jul 26, 1996
Sold by
Waterford Homes Inc
Bought by
Costa Roland C
Home Financials for this Owner
Home Financials are based on the most recent Mortgage that was taken out on this home.
Original Mortgage
$70,000
Interest Rate
8.37%
Create a Home Valuation Report for This Property
The Home Valuation Report is an in-depth analysis detailing your home's value as well as a comparison with similar homes in the area
Home Values in the Area
Average Home Value in this Area
Purchase History
| Date | Buyer | Sale Price | Title Company |
|---|---|---|---|
| Reyes Yamilet | $125,000 | -- | |
| Costa Roland C | $72,000 | -- |
Source: Public Records
Mortgage History
| Date | Status | Borrower | Loan Amount |
|---|---|---|---|
| Open | Costa Roland C | $114,468 | |
| Closed | Costa Roland C | $12,500 | |
| Previous Owner | Costa Roland C | $72,000 | |
| Previous Owner | Costa Roland C | $70,000 |
Source: Public Records
Tax History
| Year | Tax Paid | Tax Assessment Tax Assessment Total Assessment is a certain percentage of the fair market value that is determined by local assessors to be the total taxable value of land and additions on the property. | Land | Improvement |
|---|---|---|---|---|
| 2025 | $3,278 | $390,200 | $127,200 | $263,000 |
| 2024 | $5,410 | $294,800 | $80,500 | $214,300 |
| 2023 | $5,410 | $294,800 | $80,500 | $214,300 |
| 2022 | $5,247 | $294,800 | $80,500 | $214,300 |
| 2021 | $4,539 | $184,800 | $38,600 | $146,200 |
| 2020 | $4,539 | $184,800 | $38,600 | $146,200 |
| 2019 | $4,539 | $184,800 | $38,600 | $146,200 |
| 2018 | $4,410 | $138,000 | $35,100 | $102,900 |
| 2017 | $4,410 | $138,000 | $35,100 | $102,900 |
| 2016 | $4,410 | $138,000 | $35,100 | $102,900 |
| 2015 | $3,916 | $118,300 | $35,100 | $83,200 |
| 2014 | $3,993 | $118,300 | $35,100 | $83,200 |
| 2013 | $3,993 | $118,300 | $35,100 | $83,200 |
Source: Public Records
Map
Nearby Homes
Your Personal Tour Guide
Ask me questions while you tour the home.