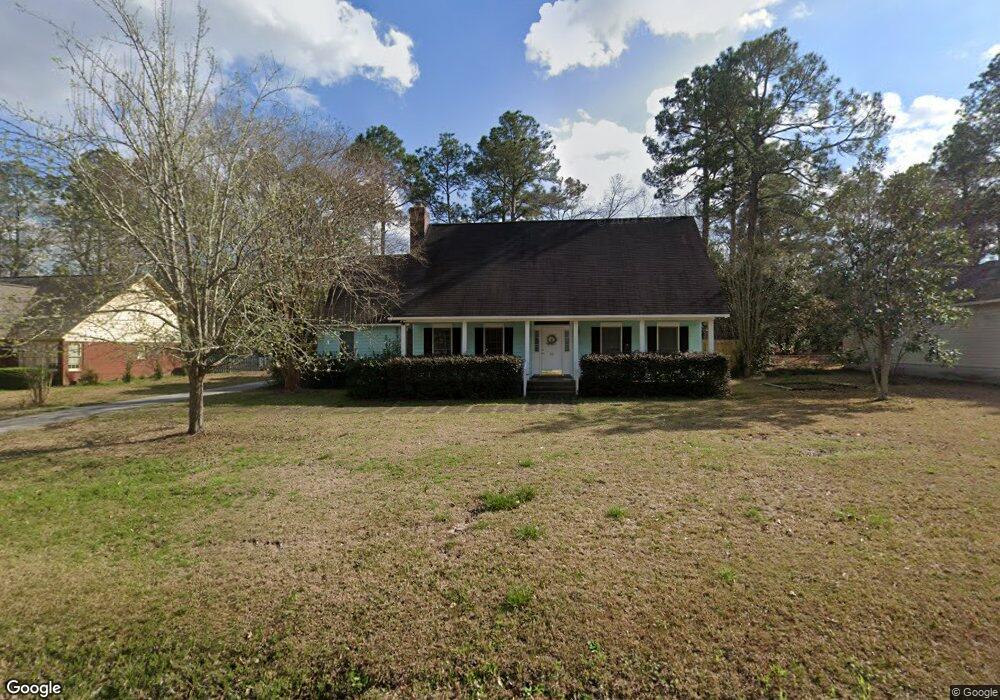
312 Rogers Rd Unit 5 Statesboro, GA 30458
Estimated Value: $264,000 - $277,000
3
Beds
3
Baths
1,715
Sq Ft
$159/Sq Ft
Est. Value
About This Home
This home is located at 312 Rogers Rd Unit 5, Statesboro, GA 30458 and is currently estimated at $271,929, approximately $158 per square foot. 312 Rogers Rd Unit 5 is a home located in Bulloch County with nearby schools including Statesboro High School, Sallie Zetterower Elementary School, and Langston Chapel Middle School.
Ownership History
Date
Name
Owned For
Owner Type
Purchase Details
Closed on
Jun 7, 2021
Sold by
Gann Tammy E
Bought by
Balas Sean T and Balas Shannon S
Current Estimated Value
Home Financials for this Owner
Home Financials are based on the most recent Mortgage that was taken out on this home.
Original Mortgage
$185,232
Outstanding Balance
$167,704
Interest Rate
2.9%
Mortgage Type
FHA
Estimated Equity
$104,225
Purchase Details
Closed on
Jun 23, 2006
Sold by
Not Provided
Bought by
Gann Tammy E
Home Financials for this Owner
Home Financials are based on the most recent Mortgage that was taken out on this home.
Original Mortgage
$94,000
Interest Rate
6.55%
Mortgage Type
New Conventional
Purchase Details
Closed on
Apr 1, 2002
Bought by
Mabry Connie
Purchase Details
Closed on
Mar 1, 1994
Bought by
Miles Deidra L
Create a Home Valuation Report for This Property
The Home Valuation Report is an in-depth analysis detailing your home's value as well as a comparison with similar homes in the area
Home Values in the Area
Average Home Value in this Area
Purchase History
| Date | Buyer | Sale Price | Title Company |
|---|---|---|---|
| Balas Sean T | $188,650 | -- | |
| Gann Tammy E | $152,000 | -- | |
| Mabry Connie | -- | -- | |
| Miles Deidra L | -- | -- |
Source: Public Records
Mortgage History
| Date | Status | Borrower | Loan Amount |
|---|---|---|---|
| Open | Balas Sean T | $185,232 | |
| Previous Owner | Gann Tammy E | $94,000 |
Source: Public Records
Tax History Compared to Growth
Tax History
| Year | Tax Paid | Tax Assessment Tax Assessment Total Assessment is a certain percentage of the fair market value that is determined by local assessors to be the total taxable value of land and additions on the property. | Land | Improvement |
|---|---|---|---|---|
| 2024 | $2,426 | $88,520 | $7,000 | $81,520 |
| 2023 | $2,034 | $71,040 | $7,040 | $64,000 |
| 2022 | $1,214 | $61,901 | $7,040 | $54,861 |
| 2021 | $951 | $47,145 | $7,040 | $40,105 |
| 2020 | $931 | $44,875 | $7,040 | $37,835 |
| 2019 | $940 | $45,048 | $7,040 | $38,008 |
| 2018 | $932 | $42,828 | $7,040 | $35,788 |
| 2017 | $902 | $40,964 | $7,040 | $33,924 |
| 2016 | $903 | $39,957 | $7,040 | $32,917 |
| 2015 | $874 | $38,521 | $7,040 | $31,481 |
| 2014 | $803 | $38,521 | $7,040 | $31,481 |
Source: Public Records
Map
Nearby Homes
- 20 Greenwood Ave
- 204 S Edgewood Dr
- 218 S Edgewood Dr
- 111 Dumbarton Dr
- 0 Henry Blvd Unit 10609902
- 9 Robin Hood Rd
- 321 Farmington Rd
- 1508 Oneal Dr
- 0 Lanier Dr Unit 10329553
- 313 Gentilly Rd
- 503 Saxon Cove
- 202 Tannery Ln
- 203 Gentilly Rd
- 0 Northside Dr E Unit 10610985
- 107 Bel Air Dr
- 0 Cawana Rd Unit 10619496
- 362 Savannah Ave
- 360 Savannah Ave
- 115 Sandy Way
- 141 Griffith Ln
- 312 Rogers Rd
- 314 Rogers Rd
- 310 Rogers Rd
- 10 Greenwood Ave
- 8 Greenwood Ave
- 308 Rogers Rd
- 311 Rogers Rd
- 316 Rogers Rd
- 313 Rogers Rd
- 12 Greenwood Ave
- 6 Greenwood Ave
- 307 Rogers Rd
- 315 Rogers Rd
- 318 Rogers Rd
- 14 Greenwood Ave
- 4 Greenwood Ave
- 306 Rogers Rd
- 102 Greentree Ct
- 305 Rogers Rd
- 0 Green Tree Ct Unit 7353674