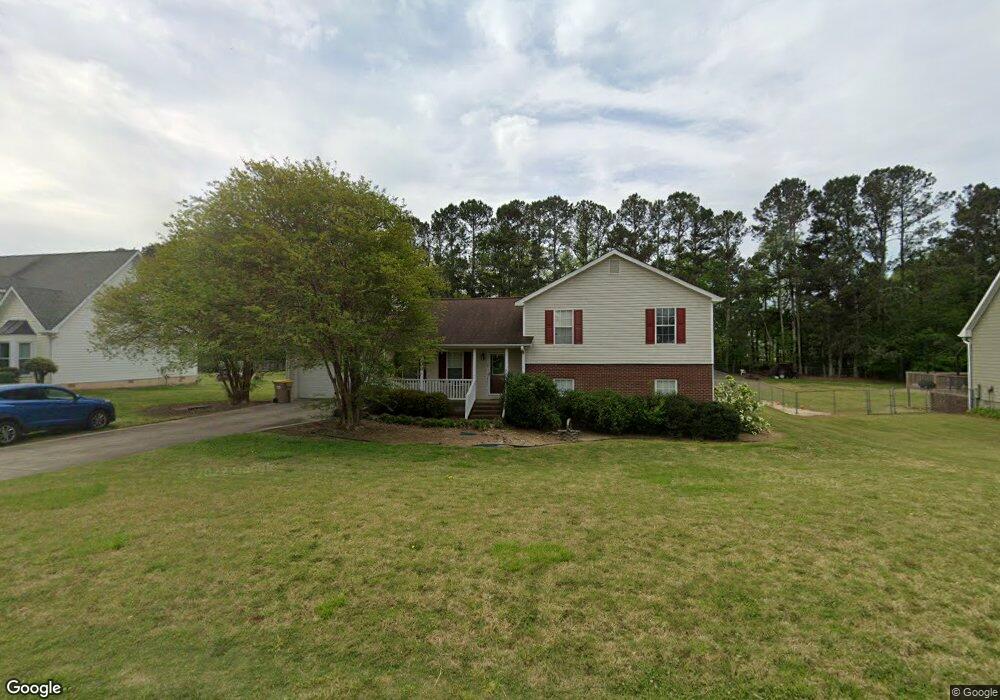
312 Ron Dr Unit 2 Bethlehem, GA 30620
Estimated Value: $306,000 - $345,000
3
Beds
2
Baths
1,398
Sq Ft
$230/Sq Ft
Est. Value
About This Home
This home is located at 312 Ron Dr Unit 2, Bethlehem, GA 30620 and is currently estimated at $320,896, approximately $229 per square foot. 312 Ron Dr Unit 2 is a home located in Barrow County with nearby schools including Yargo Elementary School, Haymon-Morris Middle School, and Apalachee High School.
Ownership History
Date
Name
Owned For
Owner Type
Purchase Details
Closed on
Jul 31, 2009
Sold by
Conley Gregory B and Conley Stephanie A
Bought by
Conley Stephanie A
Current Estimated Value
Home Financials for this Owner
Home Financials are based on the most recent Mortgage that was taken out on this home.
Original Mortgage
$104,209
Outstanding Balance
$67,629
Interest Rate
5.36%
Mortgage Type
FHA
Estimated Equity
$253,267
Purchase Details
Closed on
Apr 30, 1999
Sold by
Wade Don L
Bought by
Lonley Gregory B and Lonley Stephanie A
Home Financials for this Owner
Home Financials are based on the most recent Mortgage that was taken out on this home.
Original Mortgage
$113,900
Interest Rate
7%
Mortgage Type
New Conventional
Purchase Details
Closed on
Jun 15, 1998
Sold by
Cgs Development
Bought by
Wade Don L
Purchase Details
Closed on
Jul 9, 1996
Bought by
C G S Development In
Create a Home Valuation Report for This Property
The Home Valuation Report is an in-depth analysis detailing your home's value as well as a comparison with similar homes in the area
Home Values in the Area
Average Home Value in this Area
Purchase History
| Date | Buyer | Sale Price | Title Company |
|---|---|---|---|
| Conley Stephanie A | -- | -- | |
| Lonley Gregory B | $119,900 | -- | |
| Wade Don L | $19,000 | -- | |
| C G S Development In | -- | -- |
Source: Public Records
Mortgage History
| Date | Status | Borrower | Loan Amount |
|---|---|---|---|
| Open | Conley Stephanie A | $104,209 | |
| Previous Owner | Lonley Gregory B | $113,900 |
Source: Public Records
Tax History
| Year | Tax Paid | Tax Assessment Tax Assessment Total Assessment is a certain percentage of the fair market value that is determined by local assessors to be the total taxable value of land and additions on the property. | Land | Improvement |
|---|---|---|---|---|
| 2025 | $2,066 | $97,304 | $26,800 | $70,504 |
| 2024 | $2,120 | $95,259 | $26,800 | $68,459 |
| 2023 | $2,413 | $95,659 | $26,800 | $68,859 |
| 2022 | $2,028 | $77,967 | $22,400 | $55,567 |
| 2021 | $1,969 | $71,567 | $16,000 | $55,567 |
| 2020 | $1,655 | $58,251 | $16,000 | $42,251 |
| 2019 | $1,680 | $58,251 | $16,000 | $42,251 |
| 2018 | $1,590 | $55,451 | $13,200 | $42,251 |
| 2017 | $1,429 | $49,093 | $13,200 | $35,893 |
| 2016 | $1,243 | $43,390 | $13,200 | $30,190 |
| 2015 | $1,258 | $43,737 | $13,200 | $30,537 |
| 2014 | $1,071 | $37,351 | $6,468 | $30,883 |
| 2013 | -- | $35,539 | $6,468 | $29,071 |
Source: Public Records
Map
Nearby Homes
- 209 Angie Way
- 1256 Loganville Hwy
- 1129 Loganville Hwy
- 627 Bridle Creek Dr
- 907 Downing Dr
- 923 Downing Dr
- 732 Ridgeland Rd
- 1202 Benton Ct
- 611 Mcdowell Ln
- 1309 Tom Miller Rd
- 1188 Carl-Bethlehem Rd
- 449 Carl Bethlehem Rd SW
- 253 Meadows Dr
- 738 Worth Ct
- 286 Meadows Dr
- 308 Meadows Dr
- 724 Westbury Dr
- 631 Saddle Ridge Dr
- 763 Moss Side Dr
- 713 Carl Bethlehem Rd
- 310 Ron Dr Unit 2
- 314 Ron Dr
- 308 Ron Dr Unit 2
- 316 Ron Dr Unit 2
- 311 Ron Dr
- 313 Ron Dr
- 413 Lokeys Ridge Rd
- 306 Ron Dr Unit 2
- 411 Lokeys Ridge Rd Unit 54A
- 411 Lokeys Ridge Rd
- 413 Lokey's Ridge Rd
- 315 Ron Dr Unit 2
- 415 Lokeys Ridge Rd Unit Ga1439
- 415 Lokeys Ridge Rd
- 415 Lokeys Ridge Rd
- 415 Lokeys Ridge Rd Unit GA14395
- 307 Ron Dr Unit 2
- 318 Ron Dr
- 0 Stonewilde at Turnberr Unit 3173599
- 409 Lokeys Ridge Rd
Your Personal Tour Guide
Ask me questions while you tour the home.