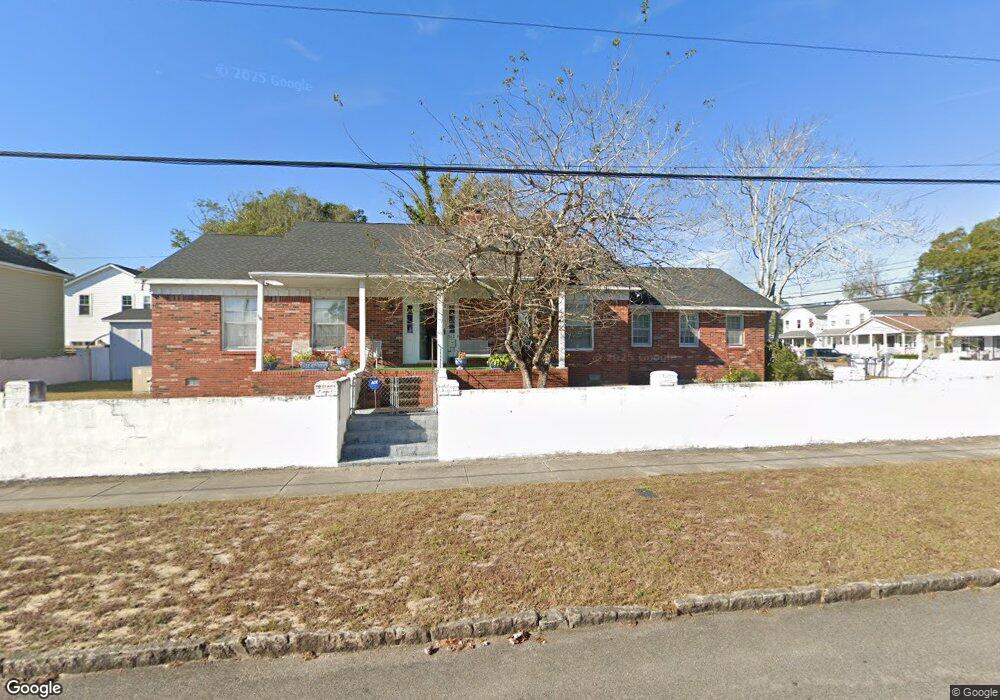
312 S 8th St Wilmington, NC 28401
Old Wilmington NeighborhoodEstimated Value: $459,000 - $587,000
3
Beds
2
Baths
1,872
Sq Ft
$291/Sq Ft
Est. Value
About This Home
This home is located at 312 S 8th St, Wilmington, NC 28401 and is currently estimated at $544,762, approximately $291 per square foot. 312 S 8th St is a home located in New Hanover County with nearby schools including Snipes Academy of Arts & Design, Williston Middle School, and New Hanover High School.
Ownership History
Date
Name
Owned For
Owner Type
Purchase Details
Closed on
Aug 27, 2002
Sold by
Dickinson Gwendolyn Franks
Bought by
Foster David L Debra A Canady
Current Estimated Value
Purchase Details
Closed on
Apr 5, 2000
Sold by
Dickinson Gwendolyn Franks
Bought by
Foster David L Debra A Canady
Purchase Details
Closed on
Jul 14, 1993
Sold by
Franks David E
Bought by
Franks David E Heirs
Purchase Details
Closed on
Dec 13, 1985
Sold by
Franks Lucille
Bought by
Franks David E
Purchase Details
Closed on
Oct 30, 1985
Sold by
Dickinson Gwendolyn Johnny
Bought by
Franks David E
Purchase Details
Closed on
Sep 27, 1985
Sold by
Hoover Dorothy F Jesse
Bought by
Dickinson Gwendolyn Johnny
Purchase Details
Closed on
Mar 20, 1985
Sold by
Franks David Earl
Bought by
Bess Lucille F Int
Purchase Details
Closed on
Jul 17, 1980
Sold by
Jackson Hazelle Franks
Bought by
Franks David Earl
Purchase Details
Closed on
Jun 1, 1967
Bought by
Jackson Hazelle Franks
Create a Home Valuation Report for This Property
The Home Valuation Report is an in-depth analysis detailing your home's value as well as a comparison with similar homes in the area
Home Values in the Area
Average Home Value in this Area
Purchase History
| Date | Buyer | Sale Price | Title Company |
|---|---|---|---|
| Foster David L Debra A Canady | -- | -- | |
| Dickinson Gwendolyn Franks | -- | -- | |
| Foster David L Debra A Canady | $50,000 | -- | |
| Dickinson Gwendolyn Franks | -- | -- | |
| Franks David E Heirs | -- | -- | |
| Franks David E | -- | -- | |
| Franks David E | -- | -- | |
| Dickinson Gwendolyn Johnny | -- | -- | |
| Bess Lucille F Int | -- | -- | |
| Franks David Earl | -- | -- | |
| Jackson Hazelle Franks | -- | -- |
Source: Public Records
Tax History Compared to Growth
Tax History
| Year | Tax Paid | Tax Assessment Tax Assessment Total Assessment is a certain percentage of the fair market value that is determined by local assessors to be the total taxable value of land and additions on the property. | Land | Improvement |
|---|---|---|---|---|
| 2025 | $2,711 | $460,700 | $87,600 | $373,100 |
| 2023 | $3,301 | $379,400 | $69,400 | $310,000 |
| 2022 | $3,225 | $379,400 | $69,400 | $310,000 |
| 2021 | $3,247 | $379,400 | $69,400 | $310,000 |
| 2020 | $2,142 | $203,300 | $58,700 | $144,600 |
| 2019 | $2,142 | $203,300 | $58,700 | $144,600 |
| 2018 | $2,142 | $203,300 | $58,700 | $144,600 |
| 2017 | $2,142 | $203,300 | $58,700 | $144,600 |
| 2016 | $2,605 | $235,100 | $97,300 | $137,800 |
| 2015 | $2,490 | $235,100 | $97,300 | $137,800 |
| 2014 | $2,384 | $235,100 | $97,300 | $137,800 |
Source: Public Records
Map
Nearby Homes