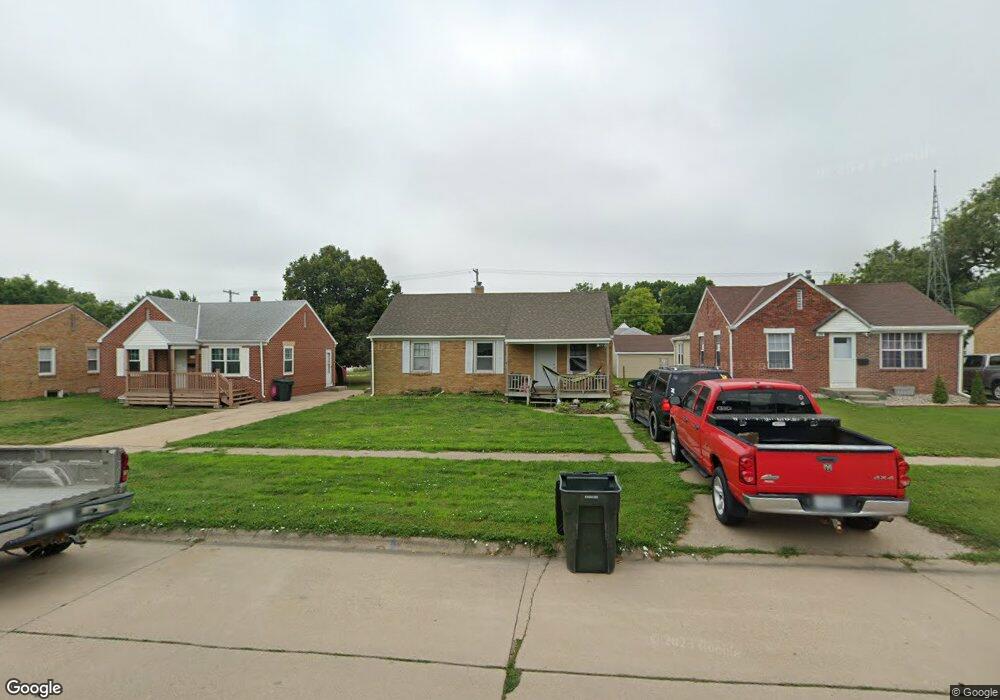
312 W 31st St Kearney, NE 68845
Estimated Value: $217,000 - $227,000
4
Beds
3
Baths
957
Sq Ft
$231/Sq Ft
Est. Value
About This Home
This home is located at 312 W 31st St, Kearney, NE 68845 and is currently estimated at $221,244, approximately $231 per square foot. 312 W 31st St is a home with nearby schools including Park Elementary School, Horizon Middle School, and Kearney Senior High School.
Ownership History
Date
Name
Owned For
Owner Type
Purchase Details
Closed on
Aug 6, 2021
Sold by
Young Matthew
Bought by
Henderson Byrd Jessica R
Current Estimated Value
Home Financials for this Owner
Home Financials are based on the most recent Mortgage that was taken out on this home.
Original Mortgage
$99,000
Outstanding Balance
$89,749
Interest Rate
2.7%
Mortgage Type
New Conventional
Estimated Equity
$131,495
Purchase Details
Closed on
Nov 19, 2015
Sold by
Smith Jeffrey A and Smith Brenda L
Bought by
Young Matthew
Home Financials for this Owner
Home Financials are based on the most recent Mortgage that was taken out on this home.
Original Mortgage
$94,500
Interest Rate
3.81%
Mortgage Type
Purchase Money Mortgage
Purchase Details
Closed on
Jun 18, 2007
Sold by
Saltzgaber Lee K and Saltzgaber Kristin F
Bought by
Smith Jeffrey A and Smith Brenda L
Home Financials for this Owner
Home Financials are based on the most recent Mortgage that was taken out on this home.
Original Mortgage
$95,400
Interest Rate
6.19%
Create a Home Valuation Report for This Property
The Home Valuation Report is an in-depth analysis detailing your home's value as well as a comparison with similar homes in the area
Home Values in the Area
Average Home Value in this Area
Purchase History
| Date | Buyer | Sale Price | Title Company |
|---|---|---|---|
| Henderson Byrd Jessica R | $175,000 | Ne Title | |
| Young Matthew | $126,000 | Barney Abstract & Title | |
| Smith Jeffrey A | $106,000 | Barney |
Source: Public Records
Mortgage History
| Date | Status | Borrower | Loan Amount |
|---|---|---|---|
| Open | Henderson Byrd Jessica R | $99,000 | |
| Previous Owner | Young Matthew | $94,500 | |
| Previous Owner | Smith Jeffrey A | $95,400 |
Source: Public Records
Tax History Compared to Growth
Tax History
| Year | Tax Paid | Tax Assessment Tax Assessment Total Assessment is a certain percentage of the fair market value that is determined by local assessors to be the total taxable value of land and additions on the property. | Land | Improvement |
|---|---|---|---|---|
| 2025 | $2,417 | $190,530 | $32,910 | $157,620 |
| 2024 | $2,417 | $182,360 | $31,950 | $150,410 |
| 2023 | $2,901 | $170,470 | $31,950 | $138,520 |
| 2022 | $2,775 | $158,155 | $32,850 | $125,305 |
| 2021 | $2,845 | $164,965 | $27,300 | $137,665 |
| 2020 | $2,801 | $161,935 | $27,300 | $134,635 |
| 2019 | $2,707 | $154,610 | $27,300 | $127,310 |
| 2018 | $2,515 | $145,715 | $27,300 | $118,415 |
| 2017 | $2,365 | $137,920 | $24,700 | $113,220 |
| 2016 | $2,326 | $136,780 | $24,700 | $112,080 |
| 2015 | $2,211 | $127,115 | $0 | $0 |
| 2014 | $2,098 | $110,065 | $0 | $0 |
Source: Public Records
Map
Nearby Homes