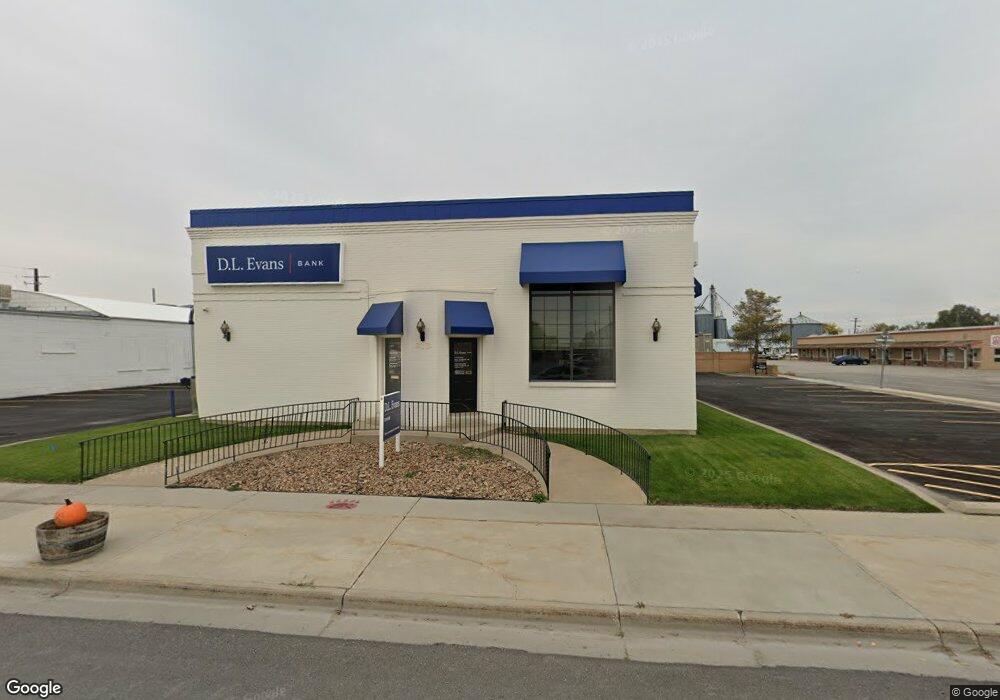
312 W Main St Tremonton, UT 84337
Estimated Value: $529,000
--
Bed
--
Bath
934
Sq Ft
$566/Sq Ft
Est. Value
About This Home
This home is located at 312 W Main St, Tremonton, UT 84337 and is currently priced at $529,000, approximately $566 per square foot. 312 W Main St is a home located in Box Elder County with nearby schools including North Park School, Alice C. Harris Intermediate School, and Bear River Middle School.
Ownership History
Date
Name
Owned For
Owner Type
Purchase Details
Closed on
Jun 15, 2018
Sold by
Pali Paul E and Pali Marilyn S
Bought by
Pali Bart and Pali Teresa
Current Estimated Value
Home Financials for this Owner
Home Financials are based on the most recent Mortgage that was taken out on this home.
Original Mortgage
$656,800
Interest Rate
4.6%
Mortgage Type
Commercial
Purchase Details
Closed on
Nov 21, 2014
Sold by
Pali Paul E and Pali Marilyn S
Bought by
Pali Paul E and Intervivo Marilyn
Create a Home Valuation Report for This Property
The Home Valuation Report is an in-depth analysis detailing your home's value as well as a comparison with similar homes in the area
Home Values in the Area
Average Home Value in this Area
Purchase History
| Date | Buyer | Sale Price | Title Company |
|---|---|---|---|
| Pali Bart | -- | American Secure Title Tremon | |
| Pali Paul E | -- | None Available |
Source: Public Records
Mortgage History
| Date | Status | Borrower | Loan Amount |
|---|---|---|---|
| Closed | Pali Bart | $656,800 |
Source: Public Records
Tax History Compared to Growth
Tax History
| Year | Tax Paid | Tax Assessment Tax Assessment Total Assessment is a certain percentage of the fair market value that is determined by local assessors to be the total taxable value of land and additions on the property. | Land | Improvement |
|---|---|---|---|---|
| 2023 | $1,404 | $315,314 | $151,804 | $163,510 |
| 2022 | $1,404 | $268,664 | $67,141 | $201,523 |
| 2021 | $1,194 | $170,420 | $66,832 | $103,588 |
| 2020 | $1,070 | $170,420 | $66,832 | $103,588 |
| 2019 | $740 | $50,122 | $16,720 | $33,402 |
| 2018 | $805 | $68,122 | $34,720 | $33,402 |
| 2017 | $854 | $314,631 | $35,731 | $60,731 |
| 2016 | $854 | $67,289 | $35,478 | $31,811 |
| 2015 | $825 | $64,623 | $35,703 | $28,920 |
| 2014 | $825 | $63,779 | $36,237 | $27,542 |
| 2013 | -- | $65,072 | $37,530 | $27,542 |
Source: Public Records
Map
Nearby Homes