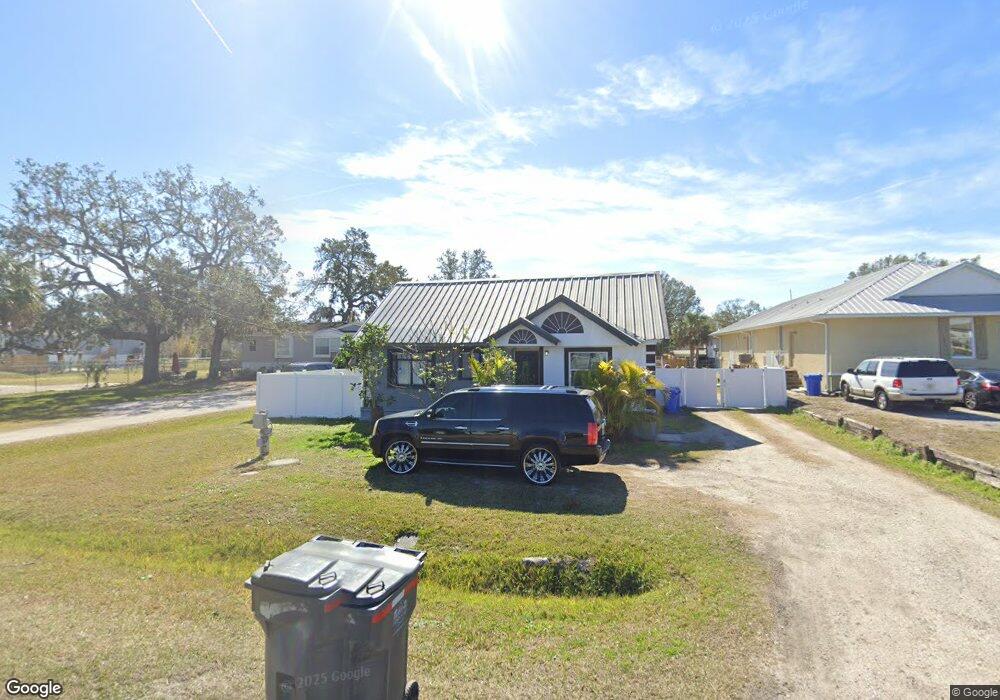
312 W Shell Point Rd Ruskin, FL 33570
Estimated Value: $161,000 - $310,000
2
Beds
1
Bath
1,764
Sq Ft
$124/Sq Ft
Est. Value
About This Home
This home is located at 312 W Shell Point Rd, Ruskin, FL 33570 and is currently estimated at $218,690, approximately $123 per square foot. 312 W Shell Point Rd is a home located in Hillsborough County with nearby schools including Thompson Elementary School, Shields Middle School, and Lennard High School.
Ownership History
Date
Name
Owned For
Owner Type
Purchase Details
Closed on
Apr 9, 2019
Sold by
Santiago Benito G
Bought by
Avila Pastor
Current Estimated Value
Home Financials for this Owner
Home Financials are based on the most recent Mortgage that was taken out on this home.
Original Mortgage
$122,000
Outstanding Balance
$115,792
Interest Rate
10%
Mortgage Type
Seller Take Back
Estimated Equity
$102,898
Purchase Details
Closed on
Apr 26, 2015
Sold by
Jordan Thomas H and Jordan Lynda F
Bought by
Santiago Benito G
Purchase Details
Closed on
Jul 15, 2004
Sold by
Santiago Benito G
Bought by
Jordan Thomas H and Jordan Lynda F
Home Financials for this Owner
Home Financials are based on the most recent Mortgage that was taken out on this home.
Original Mortgage
$90,500
Interest Rate
6%
Mortgage Type
Seller Take Back
Purchase Details
Closed on
Jun 19, 2002
Sold by
Vanderslice Robert K
Bought by
Santiago Benito G and Santiago Librada
Create a Home Valuation Report for This Property
The Home Valuation Report is an in-depth analysis detailing your home's value as well as a comparison with similar homes in the area
Home Values in the Area
Average Home Value in this Area
Purchase History
| Date | Buyer | Sale Price | Title Company |
|---|---|---|---|
| Avila Pastor | $140,000 | Community Land Ttl Ins Agcy | |
| Santiago Benito G | -- | None Available | |
| Jordan Thomas H | $107,500 | Fidelity Natl Title Ins Co | |
| Santiago Benito G | $36,300 | -- |
Source: Public Records
Mortgage History
| Date | Status | Borrower | Loan Amount |
|---|---|---|---|
| Open | Avila Pastor | $122,000 | |
| Previous Owner | Jordan Thomas H | $90,500 |
Source: Public Records
Tax History
| Year | Tax Paid | Tax Assessment Tax Assessment Total Assessment is a certain percentage of the fair market value that is determined by local assessors to be the total taxable value of land and additions on the property. | Land | Improvement |
|---|---|---|---|---|
| 2025 | $2,570 | $129,935 | $61,200 | $68,735 |
| 2024 | $2,570 | $129,952 | $61,200 | $68,752 |
| 2023 | $2,365 | $121,010 | $55,080 | $65,930 |
| 2022 | $2,178 | $120,863 | $48,960 | $71,903 |
| 2021 | $1,918 | $86,114 | $25,704 | $60,410 |
| 2020 | $1,718 | $76,845 | $24,480 | $52,365 |
| 2019 | $1,558 | $74,523 | $24,480 | $50,043 |
| 2018 | $1,477 | $70,765 | $0 | $0 |
| 2017 | $1,343 | $59,476 | $0 | $0 |
| 2016 | $1,232 | $51,274 | $0 | $0 |
| 2015 | $1,031 | $39,989 | $0 | $0 |
| 2014 | $329 | $29,820 | $0 | $0 |
| 2013 | -- | $29,379 | $0 | $0 |
Source: Public Records
Map
Nearby Homes
- 118 2nd St NW
- 503 1st Ave NW
- 446 6th Ave NW
- 201 6th St NW
- 528 Ocean Spray Dr
- 472 6th Ave NW
- 404 Inlet Rd
- 1 W Shell Point
- 204 7th Ave NW
- 0 W Shell Point Rd
- 314 Dickman Dr SW
- 404 Dickman Dr SW
- 307 Campus Dr
- 302 5th St SW
- 77 E Shell Point Rd
- 610 N US Highway 41
- 606 Dickman Dr SW
- 0 1st St NE
- 814 Fern Leaf Dr
- 220 6th Ave SW
- 310 W Shell Point Rd
- 306 W Shell Point Rd
- 307 2nd Ave NW
- 201 4th St NW
- 305 2nd Ave NW
- 302 W Shell Point Rd
- 305 W Shell Point Rd
- 303 2nd Ave NW
- 303 W Shell Point Rd
- 202 4th St NW
- 307 W Shell Point Rd
- 404 W Shell Point Rd
- 210 4th St NW
- 301 W Shell Point Rd
- 301 2nd Ave NW
- 403 2nd Ave NW
- 208 W Shell Point Rd
- 4 Th Ave NW
- 406 W Shell Point Rd Unit 101
- 308 4th Ave NW
Your Personal Tour Guide
Ask me questions while you tour the home.