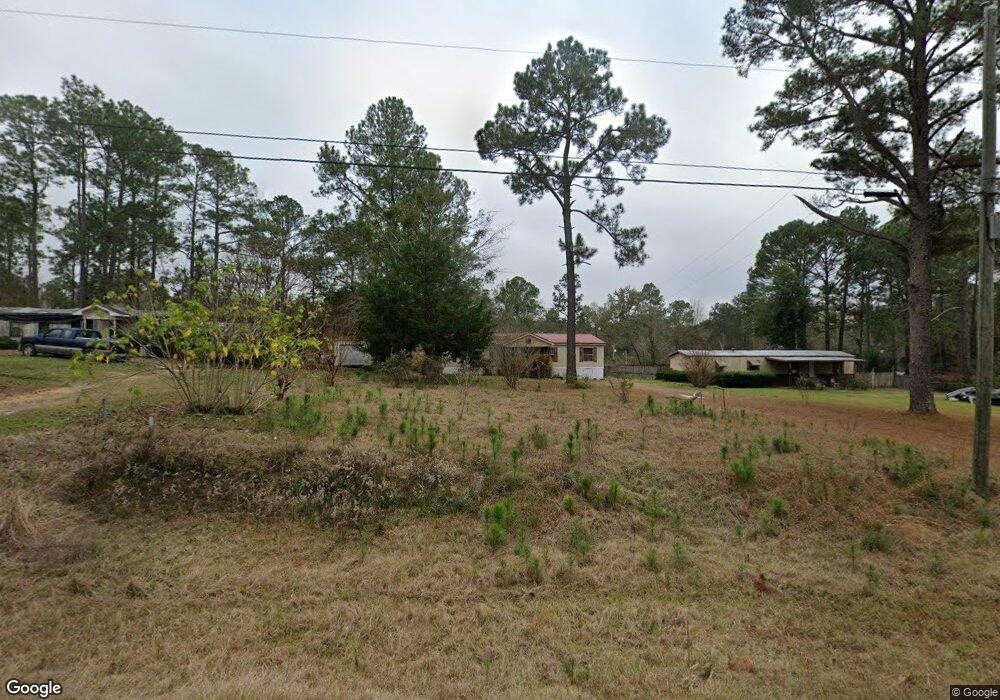
312 Wiley Rd Cordele, GA 31015
Estimated Value: $61,606 - $234,000
4
Beds
2
Baths
1,456
Sq Ft
$94/Sq Ft
Est. Value
About This Home
This home is located at 312 Wiley Rd, Cordele, GA 31015 and is currently estimated at $136,402, approximately $93 per square foot. 312 Wiley Rd is a home located in Crisp County with nearby schools including Crisp County Elementary School, Crisp County Primary School, and Crisp County Middle School.
Ownership History
Date
Name
Owned For
Owner Type
Purchase Details
Closed on
Mar 20, 2020
Sold by
Young Lonnie J
Bought by
Fountain April J
Current Estimated Value
Purchase Details
Closed on
Nov 14, 2019
Sold by
Young William Dennis
Bought by
Young Lonnie Jacob
Purchase Details
Closed on
Apr 2, 2019
Sold by
Raper Frances
Bought by
Young William Glenn and Raper Robert Shane
Purchase Details
Closed on
May 16, 2008
Sold by
Gardner Ronald E
Bought by
Penn Elizabeth Little and Penn Lee Brian
Purchase Details
Closed on
Jan 16, 2002
Sold by
Collins Kevin and Collins Donna
Bought by
Gardner Ronald E
Purchase Details
Closed on
Jan 1, 2002
Sold by
Gardner Ronald E
Bought by
Penn Elizabeth L and Penn Brian
Purchase Details
Closed on
Aug 3, 1998
Sold by
Gardner Ronald E
Bought by
Collins Kevin and Collins Don
Purchase Details
Closed on
May 29, 1998
Sold by
Stanford Margaret P
Bought by
Gardner Ronald E
Purchase Details
Closed on
Aug 4, 1983
Bought by
Stanford Margaret P
Create a Home Valuation Report for This Property
The Home Valuation Report is an in-depth analysis detailing your home's value as well as a comparison with similar homes in the area
Home Values in the Area
Average Home Value in this Area
Purchase History
| Date | Buyer | Sale Price | Title Company |
|---|---|---|---|
| Fountain April J | -- | -- | |
| Young Lonnie Jacob | -- | -- | |
| Young Lonnie Jacob | -- | -- | |
| Young William Glenn | -- | -- | |
| Penn Elizabeth Little | -- | -- | |
| Raper Frances H | $48,500 | -- | |
| Gardner Ronald E | $26,200 | -- | |
| Penn Elizabeth L | $41,500 | -- | |
| Collins Kevin | -- | -- | |
| Gardner Ronald E | $29,800 | -- | |
| Stanford Margaret P | $3,000 | -- |
Source: Public Records
Tax History Compared to Growth
Tax History
| Year | Tax Paid | Tax Assessment Tax Assessment Total Assessment is a certain percentage of the fair market value that is determined by local assessors to be the total taxable value of land and additions on the property. | Land | Improvement |
|---|---|---|---|---|
| 2024 | $115 | $4,254 | $3,060 | $1,194 |
| 2023 | $122 | $4,343 | $3,060 | $1,283 |
| 2022 | $122 | $4,166 | $0 | $4,166 |
| 2021 | $111 | $3,730 | $0 | $3,730 |
| 2020 | $268 | $8,714 | $3,060 | $5,654 |
| 2019 | $211 | $6,857 | $3,060 | $3,797 |
| 2018 | $230 | $7,476 | $3,060 | $4,416 |
| 2017 | $230 | $7,476 | $3,060 | $4,416 |
| 2016 | $230 | $7,476 | $3,060 | $4,416 |
| 2015 | -- | $7,476 | $3,060 | $4,416 |
| 2014 | -- | $13,086 | $3,060 | $10,026 |
| 2013 | -- | $15,731 | $3,060 | $12,671 |
Source: Public Records
Map
Nearby Homes
- 1806 Georgia 90
- Lot #13 Lakeview Dr
- TBD Aberdeen Circle Lot#28
- 3113 Old Hatley Rd
- 49 Aberdeen Cir
- 56 Aberdeen Cir
- 0 Aberdeen Circle Lt# 28
- 2905 Old Hatley Rd
- 2413 Old Hatley Rd
- 68 Aberdeen Cir
- 104 Aberdeen Cir
- 114 Brier Patch Rd
- 11 Lochridge Way
- 1403 Georgia 90
- 160 Old Nesbitt Rd
- 0 Old Nesbitt Rd
- 304 Timberland Dr
- 1410 E 24th Ave
- 157 Bobwhite Dr
- 1509 E 20th Ave