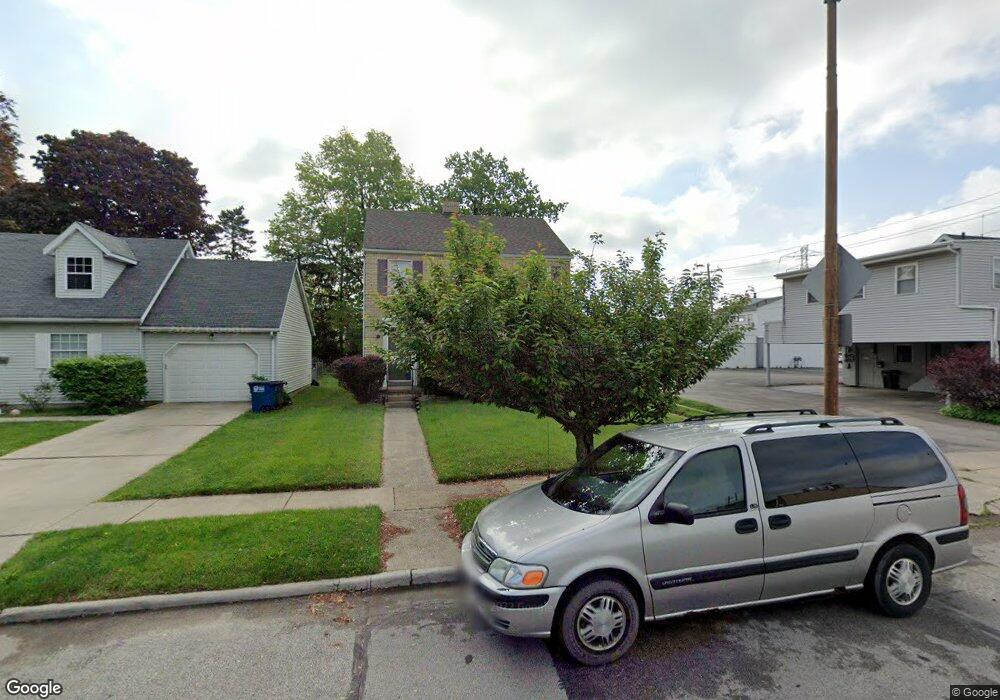
3120 Haughton Dr Toledo, OH 43606
Westgate NeighborhoodEstimated Value: $197,000 - $255,000
3
Beds
3
Baths
1,570
Sq Ft
$141/Sq Ft
Est. Value
About This Home
This home is located at 3120 Haughton Dr, Toledo, OH 43606 and is currently estimated at $221,404, approximately $141 per square foot. 3120 Haughton Dr is a home located in Lucas County with nearby schools including Old Orchard Elementary School, Start High School, and Discovery Academy.
Ownership History
Date
Name
Owned For
Owner Type
Purchase Details
Closed on
Jun 30, 2003
Sold by
Sharp James N and Sharp Christie M
Bought by
Farthing Timothy A and Farthing Dana M
Current Estimated Value
Home Financials for this Owner
Home Financials are based on the most recent Mortgage that was taken out on this home.
Original Mortgage
$44,000
Outstanding Balance
$18,904
Interest Rate
5.4%
Mortgage Type
Purchase Money Mortgage
Estimated Equity
$202,500
Purchase Details
Closed on
Jul 9, 1996
Sold by
Najjar Nada F
Bought by
Sharp James N
Home Financials for this Owner
Home Financials are based on the most recent Mortgage that was taken out on this home.
Original Mortgage
$68,850
Interest Rate
8.07%
Mortgage Type
New Conventional
Purchase Details
Closed on
Dec 6, 1994
Sold by
Trst C E Durdel
Bought by
Najjar Nada F
Home Financials for this Owner
Home Financials are based on the most recent Mortgage that was taken out on this home.
Original Mortgage
$44,500
Interest Rate
5.5%
Mortgage Type
New Conventional
Purchase Details
Closed on
Nov 13, 1990
Sold by
Durdel Clifford E
Create a Home Valuation Report for This Property
The Home Valuation Report is an in-depth analysis detailing your home's value as well as a comparison with similar homes in the area
Home Values in the Area
Average Home Value in this Area
Purchase History
| Date | Buyer | Sale Price | Title Company |
|---|---|---|---|
| Farthing Timothy A | $94,000 | Louisville Title Agency For | |
| Sharp James N | $76,500 | -- | |
| Najjar Nada F | $64,500 | -- | |
| -- | -- | -- |
Source: Public Records
Mortgage History
| Date | Status | Borrower | Loan Amount |
|---|---|---|---|
| Open | Farthing Timothy A | $44,000 | |
| Previous Owner | Sharp James N | $68,850 | |
| Previous Owner | Najjar Nada F | $44,500 |
Source: Public Records
Tax History Compared to Growth
Tax History
| Year | Tax Paid | Tax Assessment Tax Assessment Total Assessment is a certain percentage of the fair market value that is determined by local assessors to be the total taxable value of land and additions on the property. | Land | Improvement |
|---|---|---|---|---|
| 2024 | $1,600 | $52,395 | $8,435 | $43,960 |
| 2023 | $2,533 | $39,340 | $7,070 | $32,270 |
| 2022 | $2,537 | $39,340 | $7,070 | $32,270 |
| 2021 | $2,602 | $39,340 | $7,070 | $32,270 |
| 2020 | $2,470 | $33,005 | $5,845 | $27,160 |
| 2019 | $2,408 | $33,005 | $5,845 | $27,160 |
| 2018 | $2,357 | $33,005 | $5,845 | $27,160 |
| 2017 | $2,337 | $30,310 | $7,840 | $22,470 |
| 2016 | $2,327 | $86,600 | $22,400 | $64,200 |
| 2015 | $2,303 | $86,600 | $22,400 | $64,200 |
| 2014 | $1,959 | $30,310 | $7,840 | $22,470 |
| 2013 | $1,959 | $30,310 | $7,840 | $22,470 |
Source: Public Records
Map
Nearby Homes
- 3031 Douglas Rd
- 2927 Sherbrooke Rd
- 3037 Sherbrooke Rd
- 2719 Letchworth Pkwy
- 3350 Wyckliffe Pkwy
- 3512 Rushland Ave
- 3512 Wyckliffe Pkwy
- 2627 Latonia Blvd
- 3115 Drummond Rd
- 3251 Northwood Ave
- 2939 Midwood Ave
- 2636 Powhattan Pkwy
- 2838 Meadowwood Dr
- 3233 Saint Bernard Dr
- 3010 W Central Ave
- 3538 Grantley Rd
- 3306 Saint Bernard Dr
- 3540 Kershaw Ave
- 3433 Goddard Rd
- 3560 Bellevue Rd
- 3116 Haughton Dr
- 2628 W Central Ave
- 3126 Haughton Dr
- 2610 Central Ave
- 3125 Douglas Rd
- 2629 Central Ave
- 2636 W Central Ave
- 3115 Haughton Dr
- 3119 Haughton Dr
- 3138 Haughton Dr
- 3125 Haughton Dr
- 3131 Haughton Dr
- 2627 W Central Ave
- 2627 W Central Ave
- 2613 W Central Ave
- 3139 Douglas Rd
- 2648 Central Ave
- 3144 Haughton Dr
- 3135 Haughton Dr
- 3141 Douglas Rd