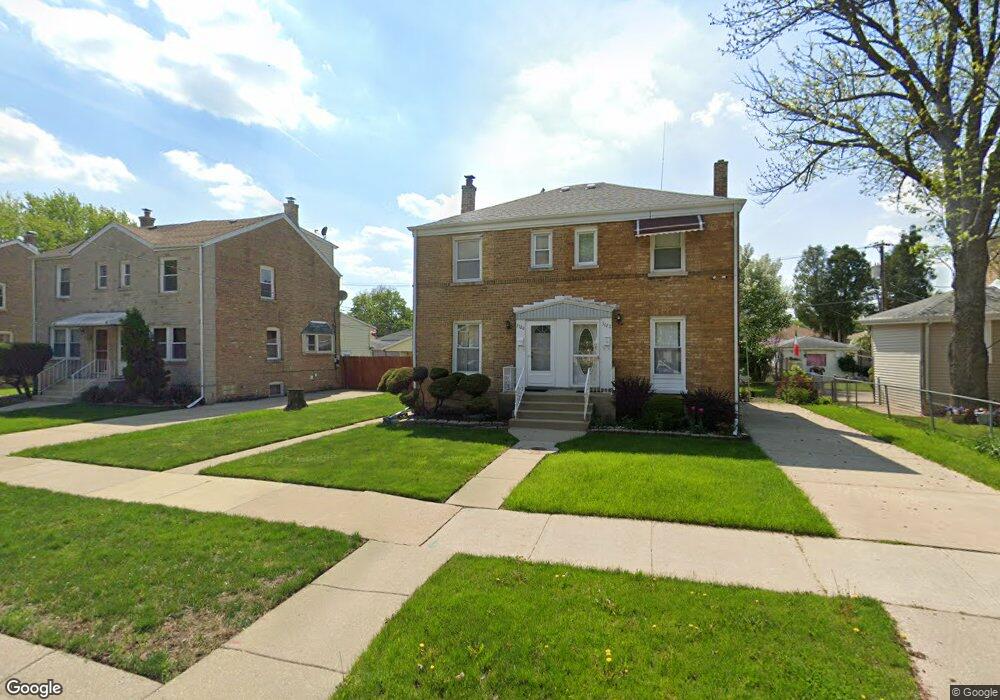
3120 Scott St Franklin Park, IL 60131
Estimated Value: $257,962 - $308,000
2
Beds
1
Bath
1,122
Sq Ft
$252/Sq Ft
Est. Value
About This Home
This home is located at 3120 Scott St, Franklin Park, IL 60131 and is currently estimated at $282,241, approximately $251 per square foot. 3120 Scott St is a home located in Cook County with nearby schools including Passow Elementary School, Hester Jr High School, and West Leyden High School.
Ownership History
Date
Name
Owned For
Owner Type
Purchase Details
Closed on
Jul 11, 2007
Sold by
Korsch Carol M
Bought by
Martinez Arturo and Martinez Isela
Current Estimated Value
Home Financials for this Owner
Home Financials are based on the most recent Mortgage that was taken out on this home.
Original Mortgage
$165,000
Outstanding Balance
$103,067
Interest Rate
6.76%
Mortgage Type
New Conventional
Estimated Equity
$179,174
Purchase Details
Closed on
Jul 17, 1995
Sold by
Korsch Carol M
Bought by
Korsch Carol M
Create a Home Valuation Report for This Property
The Home Valuation Report is an in-depth analysis detailing your home's value as well as a comparison with similar homes in the area
Home Values in the Area
Average Home Value in this Area
Purchase History
| Date | Buyer | Sale Price | Title Company |
|---|---|---|---|
| Martinez Arturo | $215,000 | Cti | |
| Korsch Carol M | -- | Chicago Title Insurance Co |
Source: Public Records
Mortgage History
| Date | Status | Borrower | Loan Amount |
|---|---|---|---|
| Open | Martinez Arturo | $165,000 |
Source: Public Records
Tax History
| Year | Tax Paid | Tax Assessment Tax Assessment Total Assessment is a certain percentage of the fair market value that is determined by local assessors to be the total taxable value of land and additions on the property. | Land | Improvement |
|---|---|---|---|---|
| 2025 | $5,738 | $24,001 | $4,263 | $19,738 |
| 2024 | $5,738 | $22,000 | $3,500 | $18,500 |
| 2023 | $5,888 | $22,000 | $3,500 | $18,500 |
| 2022 | $5,888 | $22,000 | $3,500 | $18,500 |
| 2021 | $4,032 | $13,511 | $2,518 | $10,993 |
| 2020 | $3,922 | $13,511 | $2,518 | $10,993 |
| 2019 | $4,102 | $15,267 | $2,518 | $12,749 |
| 2018 | $4,399 | $14,338 | $2,131 | $12,207 |
| 2017 | $4,360 | $14,338 | $2,131 | $12,207 |
| 2016 | $5,006 | $16,041 | $2,131 | $13,910 |
| 2015 | $4,602 | $14,409 | $1,937 | $12,472 |
| 2014 | $4,502 | $14,409 | $1,937 | $12,472 |
| 2013 | $4,151 | $14,409 | $1,937 | $12,472 |
Source: Public Records
Map
Nearby Homes
- 2843 Hawthorne St
- 9670 Franklin Ave Unit 508
- 9670 Franklin Ave Unit 411
- 3013 Lincoln St
- 3108 Lincoln St
- 9741 Lonnquist Dr
- 3516 Elder Ln
- 3044 Rose St
- 3427 Lonnquist Dr
- 10729 W Grand Ave
- 3541 Emerson St
- 3529 George St
- 2920 Pearl St
- 2618 Hawthorne St
- 9822 Richard Ave
- 3631 Elder Ln
- 3640 Hawthorne St
- 2839 Pearl St
- 2609 Elder Ln
- 10129 Westmanor Dr
Your Personal Tour Guide
Ask me questions while you tour the home.